Fig. 5
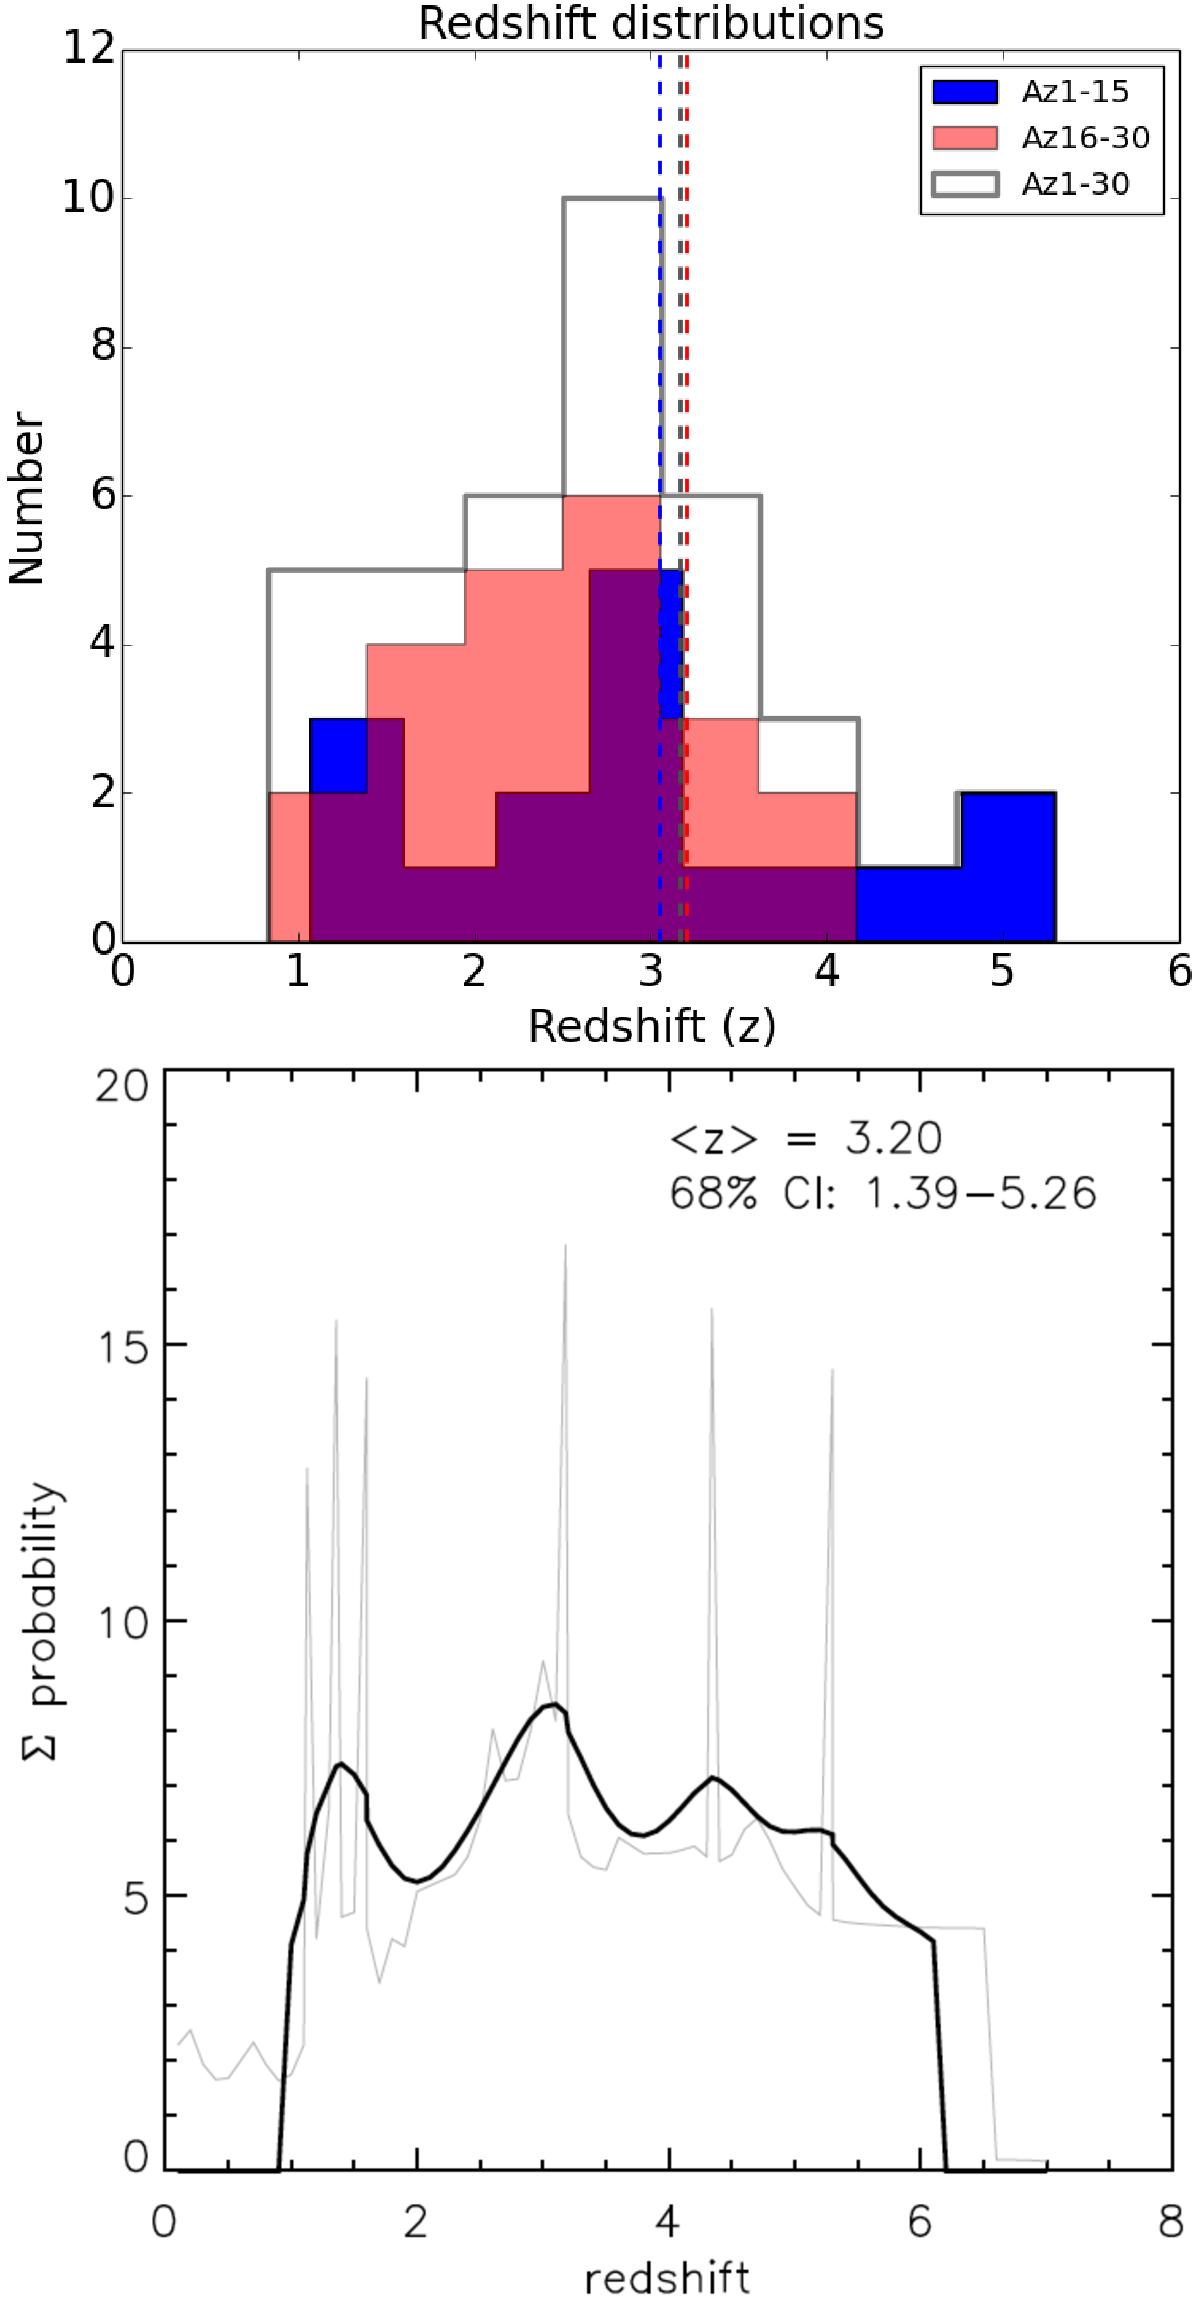
Top: distribution of redshifts of the studied SMGs. The blue filled histogram shows the redshift distribution of the SMGs AzTEC1−15, while the red filled histogram shows that of AzTEC16−30. The open grey histogram indicates the redshift distribution of the combined sample (AzTEC1−30). The vertical dashed lines mark the corresponding median redshifts (blue: ![]() ; red:
; red: ![]() ; grey:
; grey: ![]() ). The lower redshift limits (see Table 4) were placed in the bins corresponding to those values, but the indicated median redshifts were properly derived through survival analysis. Bottom: probability density distribution of the redshifts of AzTEC1−30. The light grey curve shows the unsmoothed distribution, and the black curve represents the Gaussian-smoothed kernel density estimate (see text for details). The median redshift and the 68% CI are indicated.
). The lower redshift limits (see Table 4) were placed in the bins corresponding to those values, but the indicated median redshifts were properly derived through survival analysis. Bottom: probability density distribution of the redshifts of AzTEC1−30. The light grey curve shows the unsmoothed distribution, and the black curve represents the Gaussian-smoothed kernel density estimate (see text for details). The median redshift and the 68% CI are indicated.
Current usage metrics show cumulative count of Article Views (full-text article views including HTML views, PDF and ePub downloads, according to the available data) and Abstracts Views on Vision4Press platform.
Data correspond to usage on the plateform after 2015. The current usage metrics is available 48-96 hours after online publication and is updated daily on week days.
Initial download of the metrics may take a while.