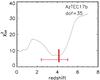
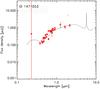
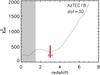
Fig. 4
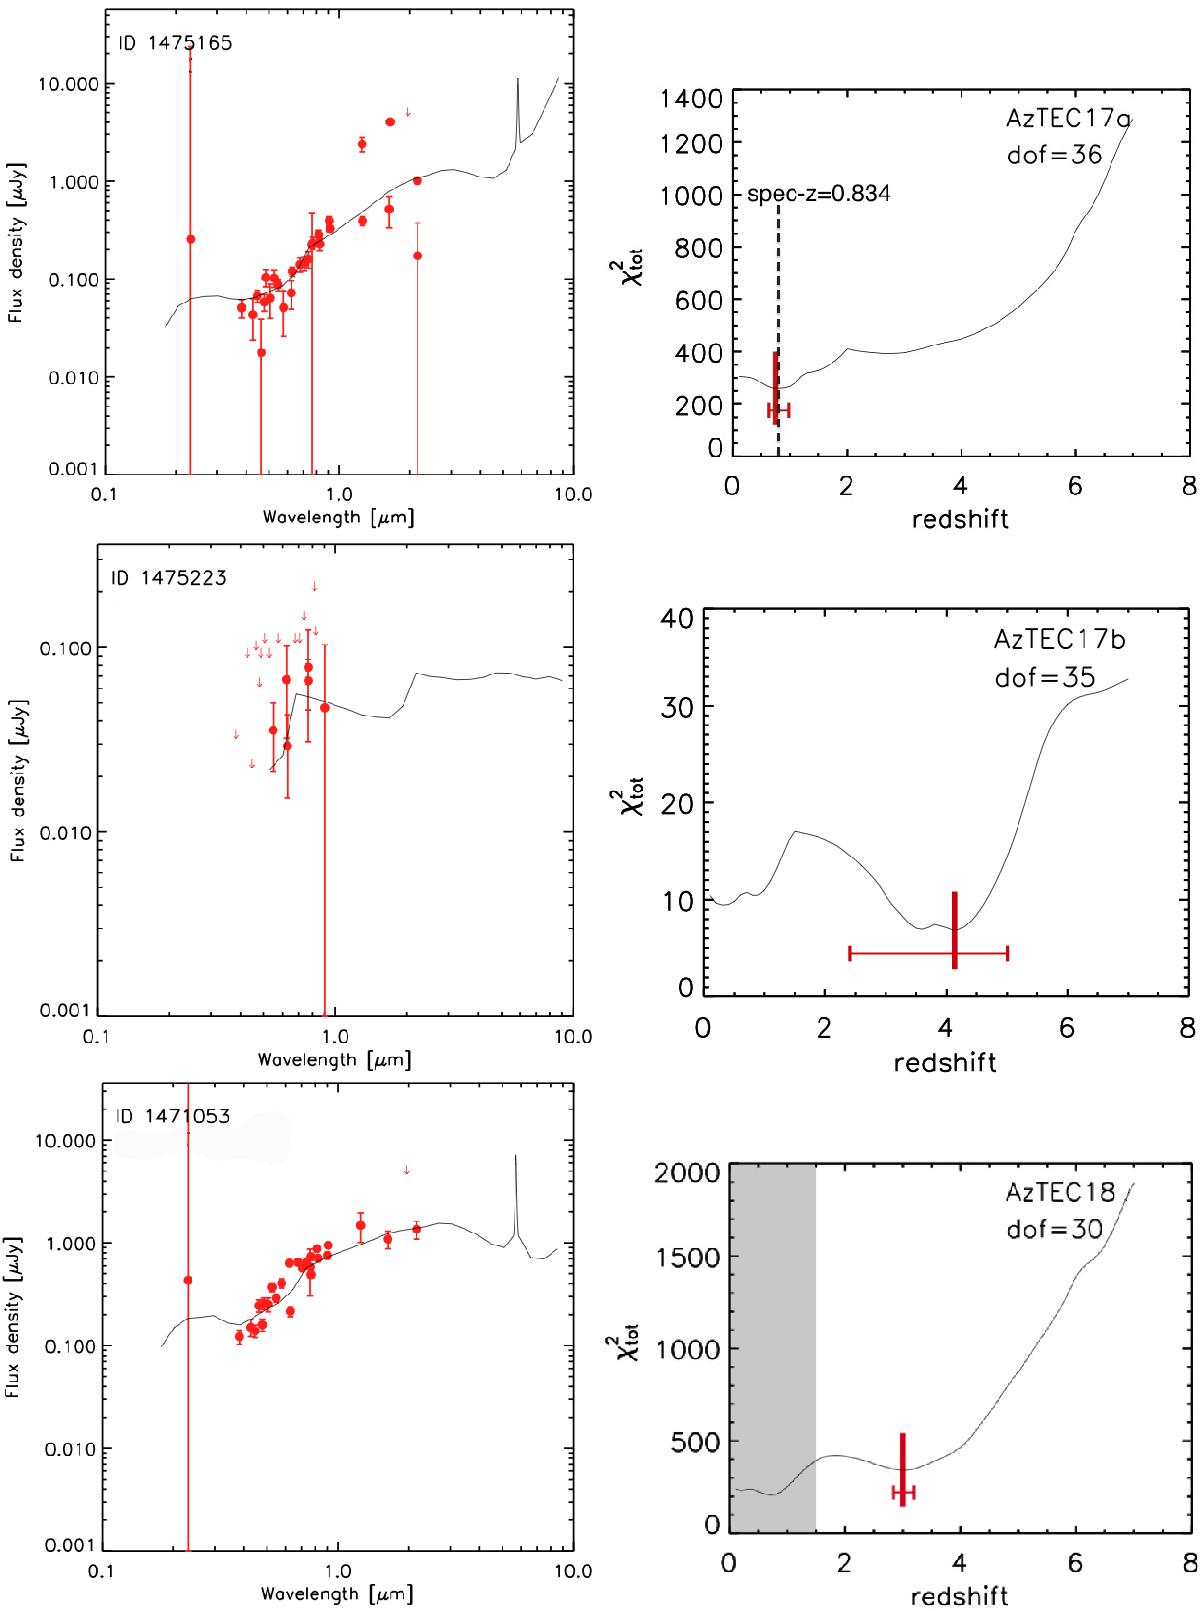
Spectral energy distributions of the optical-to-IR counterparts of our SMGs. The red filled circles with error bars represent the photometric data points, while upper limits are denoted by downward pointing arrows (some of the data points with large error bars, such as the GALEX NUV (λeff ≃ 0.2316μm), are also upper limits). The solid lines represent the best-fit HYPERZ model to these data from the spectral model library of Michałowski et al. (2010). The panels on the right side show the corresponding total χ2 distributions as a function of redshift. The number of degrees of freedom (dof) in the χ2 minimisation is indicated in the top right corner of each panel. The grey shaded area in the AzTEC18, 19a, 21a, 21b, 23, and 26a panels indicates the z range ignored in the determination of the best-fit photo-z solution (two almost equally probable zphot solutions, where the higher zphot is supported by the radio non-detection; see Appendix C). The thick red vertical line marks the best-fit zphot value, and the thin red horizontal line shows the 99% CI. The vertical dashed line in the AzTEC17a panel marks the spectroscopic redshift zspec = 0.834 (Appendix C).
Current usage metrics show cumulative count of Article Views (full-text article views including HTML views, PDF and ePub downloads, according to the available data) and Abstracts Views on Vision4Press platform.
Data correspond to usage on the plateform after 2015. The current usage metrics is available 48-96 hours after online publication and is updated daily on week days.
Initial download of the metrics may take a while.