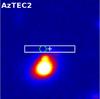
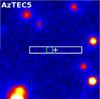
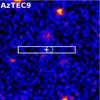
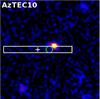
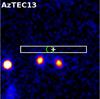
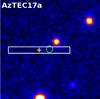
Fig. E.1
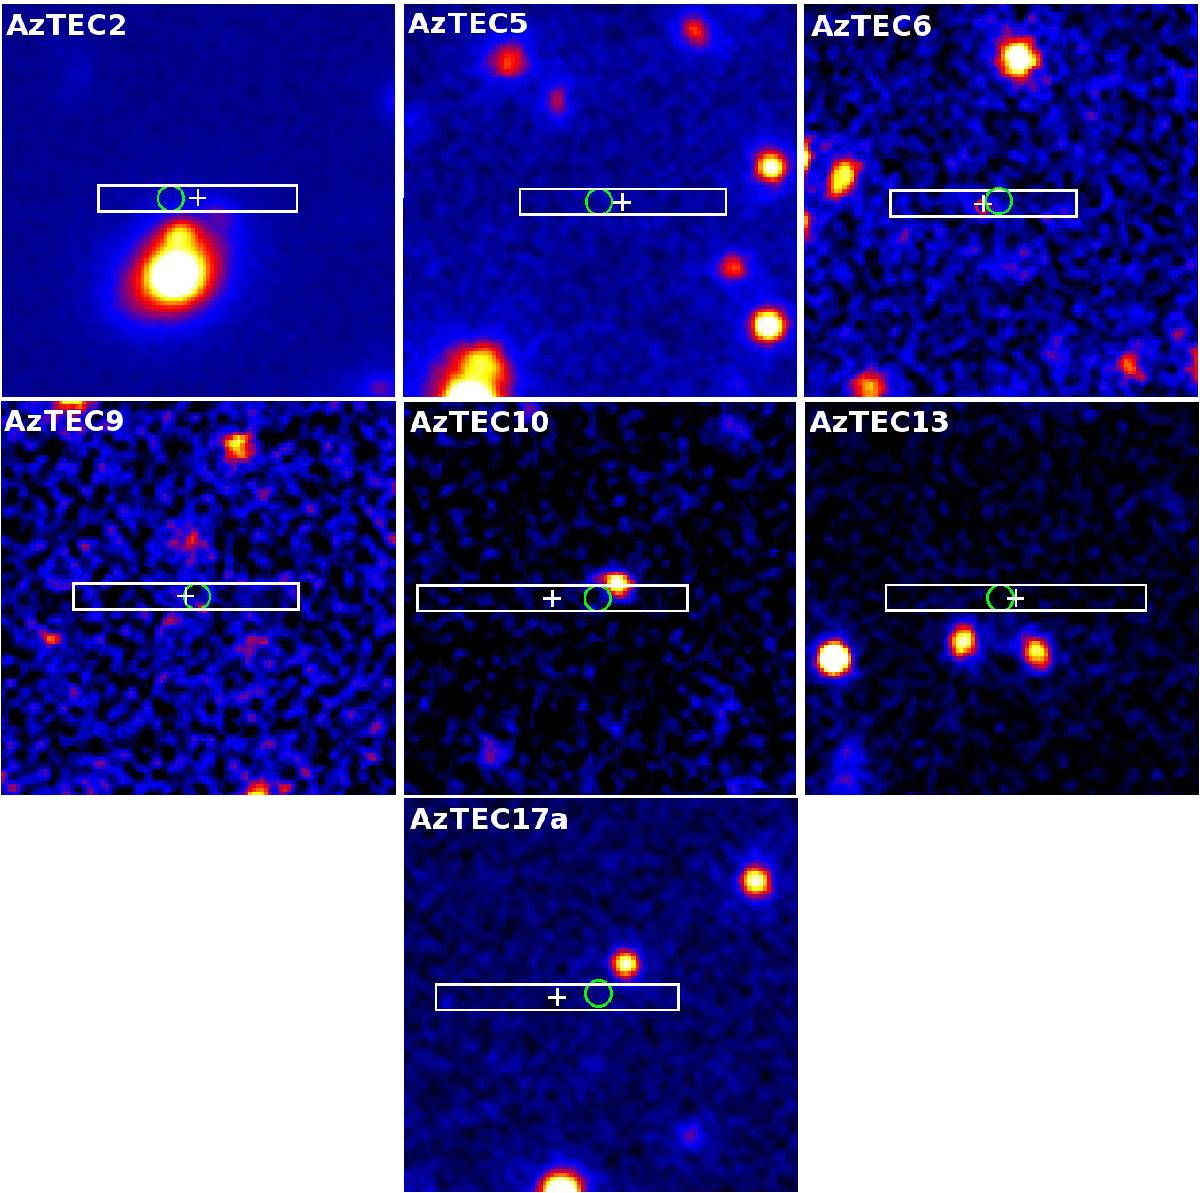
UltraVISTA Y-band (λeff = 1.02μm) images towards AzTEC2, 5, 6, 9, 10, 13, and 17a shown in linear scale. All the images are 15″ on a side. The white rectangles indicate the DEIMOS slit positions, sizes, and orientations (see Table E.1). We note that all the slits were aligned horizontally along the east-west direction. The central position of the slit is marked with a white plus sign, while the green circle of radius ![]() shows the SMA 890 μm peak position (Younger et al. 2007, 2009) except in the case of AzTEC17a where it marks the PdBI 1.3 mm peak position. The red circle in the AzTEC6 panel represents the optical galaxy discussed by Koprowski et al. (2014); see Appendix B for details.
shows the SMA 890 μm peak position (Younger et al. 2007, 2009) except in the case of AzTEC17a where it marks the PdBI 1.3 mm peak position. The red circle in the AzTEC6 panel represents the optical galaxy discussed by Koprowski et al. (2014); see Appendix B for details.
Current usage metrics show cumulative count of Article Views (full-text article views including HTML views, PDF and ePub downloads, according to the available data) and Abstracts Views on Vision4Press platform.
Data correspond to usage on the plateform after 2015. The current usage metrics is available 48-96 hours after online publication and is updated daily on week days.
Initial download of the metrics may take a while.