Fig. 8
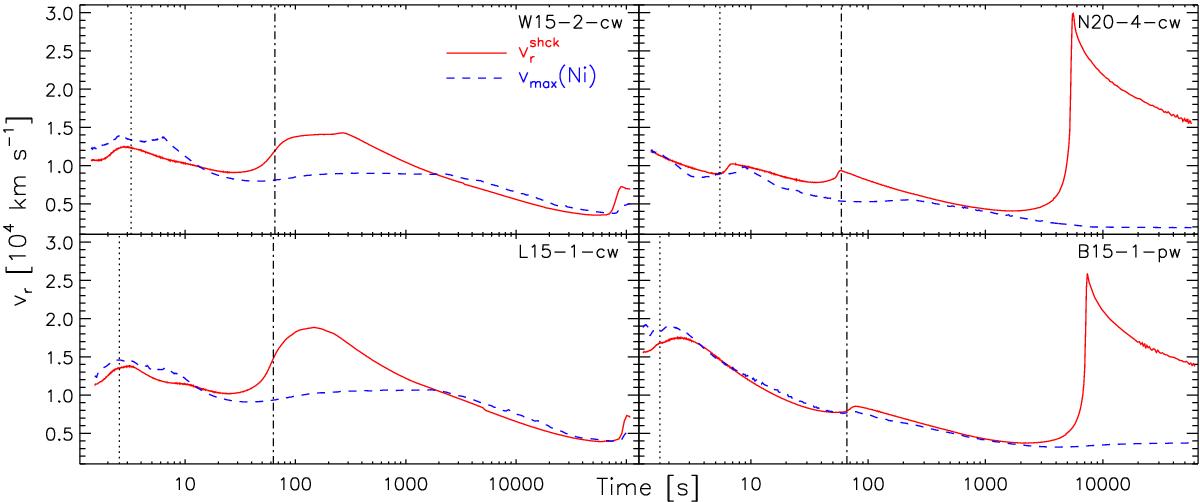
Time evolution of the radial velocity of the SN shock, ![]() (solid red), and of the maximum radial velocity, vmax(Ni) (dashed blue), on the surface where the mass fraction of 56Ni plus the n-rich tracer X equals 3%, for models W15-2-cw, N20-4-cw, L15-1-cw, and B15-1-pw, respectively. The vertical dotted and dashed-dotted lines mark the times when the shock crosses the C+O/He and He/H interfaces, respectively. These times are identical to those of the snapshots shown in the first and second columns of Fig. 7.
(solid red), and of the maximum radial velocity, vmax(Ni) (dashed blue), on the surface where the mass fraction of 56Ni plus the n-rich tracer X equals 3%, for models W15-2-cw, N20-4-cw, L15-1-cw, and B15-1-pw, respectively. The vertical dotted and dashed-dotted lines mark the times when the shock crosses the C+O/He and He/H interfaces, respectively. These times are identical to those of the snapshots shown in the first and second columns of Fig. 7.
Current usage metrics show cumulative count of Article Views (full-text article views including HTML views, PDF and ePub downloads, according to the available data) and Abstracts Views on Vision4Press platform.
Data correspond to usage on the plateform after 2015. The current usage metrics is available 48-96 hours after online publication and is updated daily on week days.
Initial download of the metrics may take a while.