Fig. 6
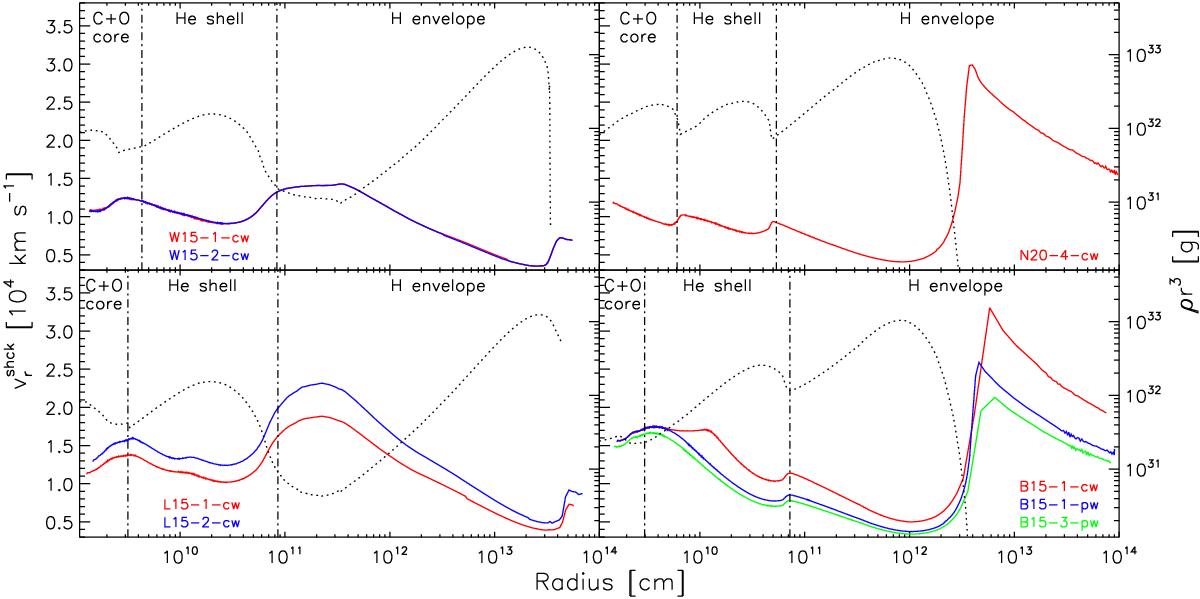
Radial velocity of the angle-averaged shock radius, ![]() , as a function of radius for our eight 3D models grouped in panels according to the respective progenitor model: W15 (top left), L15 (bottom left), N20 (top right), and B15 (bottom right). In each panel, we also display the corresponding distribution of ρr3 inside the progenitor star (black dotted line), where the scale given on the righthand side of the plot. The radii of the C+O/He and He/H composition interfaces in the progenitor star (defined in Sect. 2.1) are indicated by the vertical dash-dotted lines.
, as a function of radius for our eight 3D models grouped in panels according to the respective progenitor model: W15 (top left), L15 (bottom left), N20 (top right), and B15 (bottom right). In each panel, we also display the corresponding distribution of ρr3 inside the progenitor star (black dotted line), where the scale given on the righthand side of the plot. The radii of the C+O/He and He/H composition interfaces in the progenitor star (defined in Sect. 2.1) are indicated by the vertical dash-dotted lines.
Current usage metrics show cumulative count of Article Views (full-text article views including HTML views, PDF and ePub downloads, according to the available data) and Abstracts Views on Vision4Press platform.
Data correspond to usage on the plateform after 2015. The current usage metrics is available 48-96 hours after online publication and is updated daily on week days.
Initial download of the metrics may take a while.