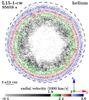
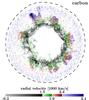
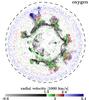
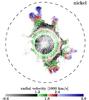
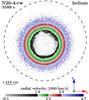
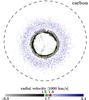
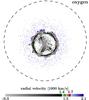
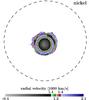
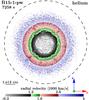
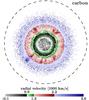
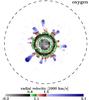
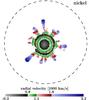
Fig. 14
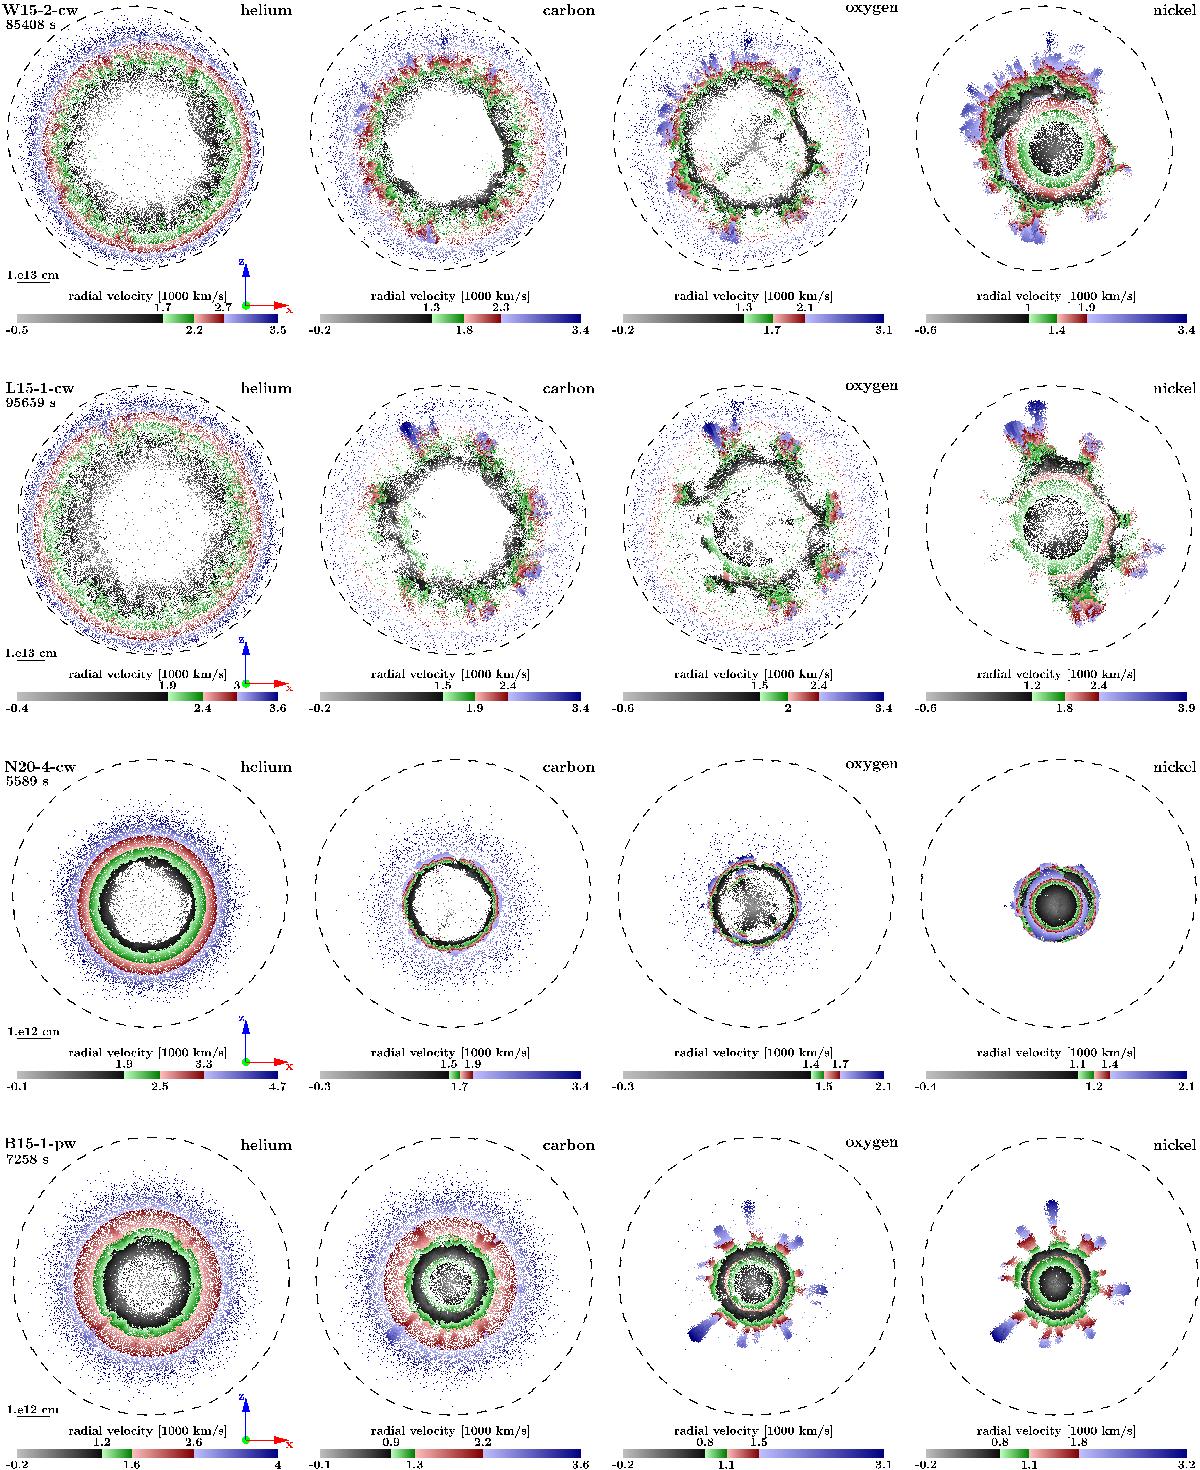
Particle representations of the spatial distributions of He, C, O, and Ni+X for models W15-2-cw, L15-1-cw, N20-4-cw, and B15-1-pw (from top) at the time of shock breakout. We show only particles within a slab given by ![]() . The dashed lines give the shock’s location in the y = 0 plane. The particles are colored according to their radial velocity, which is binned into four bins, each bin containing 25% of the total mass of the element. Blackish particles represent the slowest 25% by mass of an element, while bluish particles mark the fastest 25%. The black thin shell contains matter that was hit by the reverse shock, and thus moves slower than matter located inside this shell (reddish and greenish particles). The positive y-axis points away from the viewer.
. The dashed lines give the shock’s location in the y = 0 plane. The particles are colored according to their radial velocity, which is binned into four bins, each bin containing 25% of the total mass of the element. Blackish particles represent the slowest 25% by mass of an element, while bluish particles mark the fastest 25%. The black thin shell contains matter that was hit by the reverse shock, and thus moves slower than matter located inside this shell (reddish and greenish particles). The positive y-axis points away from the viewer.

Current usage metrics show cumulative count of Article Views (full-text article views including HTML views, PDF and ePub downloads, according to the available data) and Abstracts Views on Vision4Press platform.
Data correspond to usage on the plateform after 2015. The current usage metrics is available 48-96 hours after online publication and is updated daily on week days.
Initial download of the metrics may take a while.