Free Access
Fig. 7
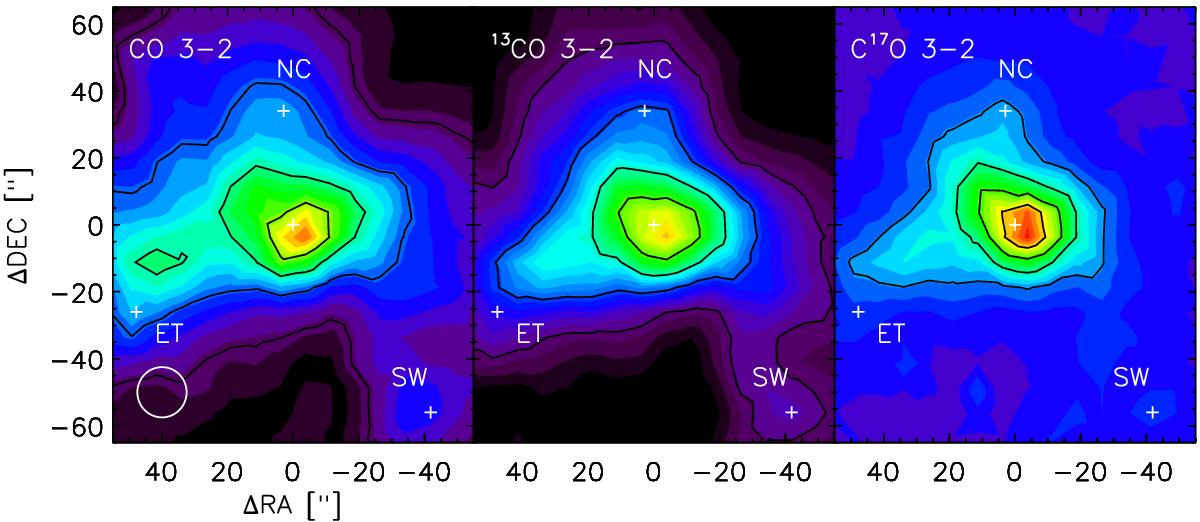
Spatial distribution of CO, 13CO, and C17O line emission. The crosses correspond to subregions: source center, eastern tail (ET), northern clump (NC), and southwest clump (SW). The contours correspond to the 20%, 40%, 60%, and 80% of the maximum line intensity.
Current usage metrics show cumulative count of Article Views (full-text article views including HTML views, PDF and ePub downloads, according to the available data) and Abstracts Views on Vision4Press platform.
Data correspond to usage on the plateform after 2015. The current usage metrics is available 48-96 hours after online publication and is updated daily on week days.
Initial download of the metrics may take a while.