Fig. 4
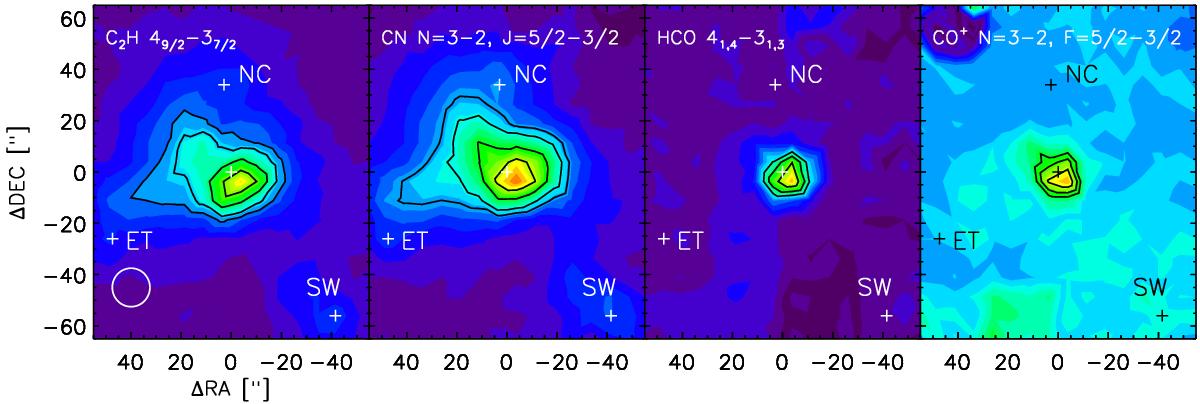
Spatial distribution of species that can be related to PDR chemistry. For C2H and CN, the contours correspond to the 30%, 40%, 60%, and 80% of the maximum line intensity. For CO+ and HCO the contours correspond to the 45%, 60%, and 80% of the maximum line intensity. The different percentages used for the contour levels for the CO+ and HCO integrated intensities is due to the lower signal-to-noise of these species compared to C2H and CN.
Current usage metrics show cumulative count of Article Views (full-text article views including HTML views, PDF and ePub downloads, according to the available data) and Abstracts Views on Vision4Press platform.
Data correspond to usage on the plateform after 2015. The current usage metrics is available 48-96 hours after online publication and is updated daily on week days.
Initial download of the metrics may take a while.