Free Access
Fig. A.5
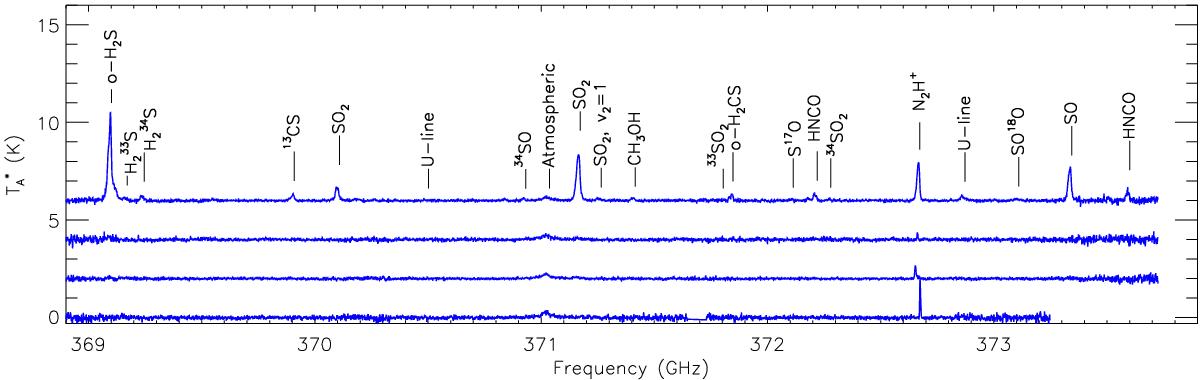
Identified lines toward the (from bottom to top) eastern tail, northern clump, southwest clump regions, and the center of of W49A in the frequency range between 369 GHz and 374 GHz.
Current usage metrics show cumulative count of Article Views (full-text article views including HTML views, PDF and ePub downloads, according to the available data) and Abstracts Views on Vision4Press platform.
Data correspond to usage on the plateform after 2015. The current usage metrics is available 48-96 hours after online publication and is updated daily on week days.
Initial download of the metrics may take a while.