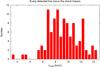
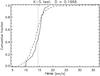
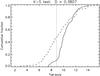
Fig. 14
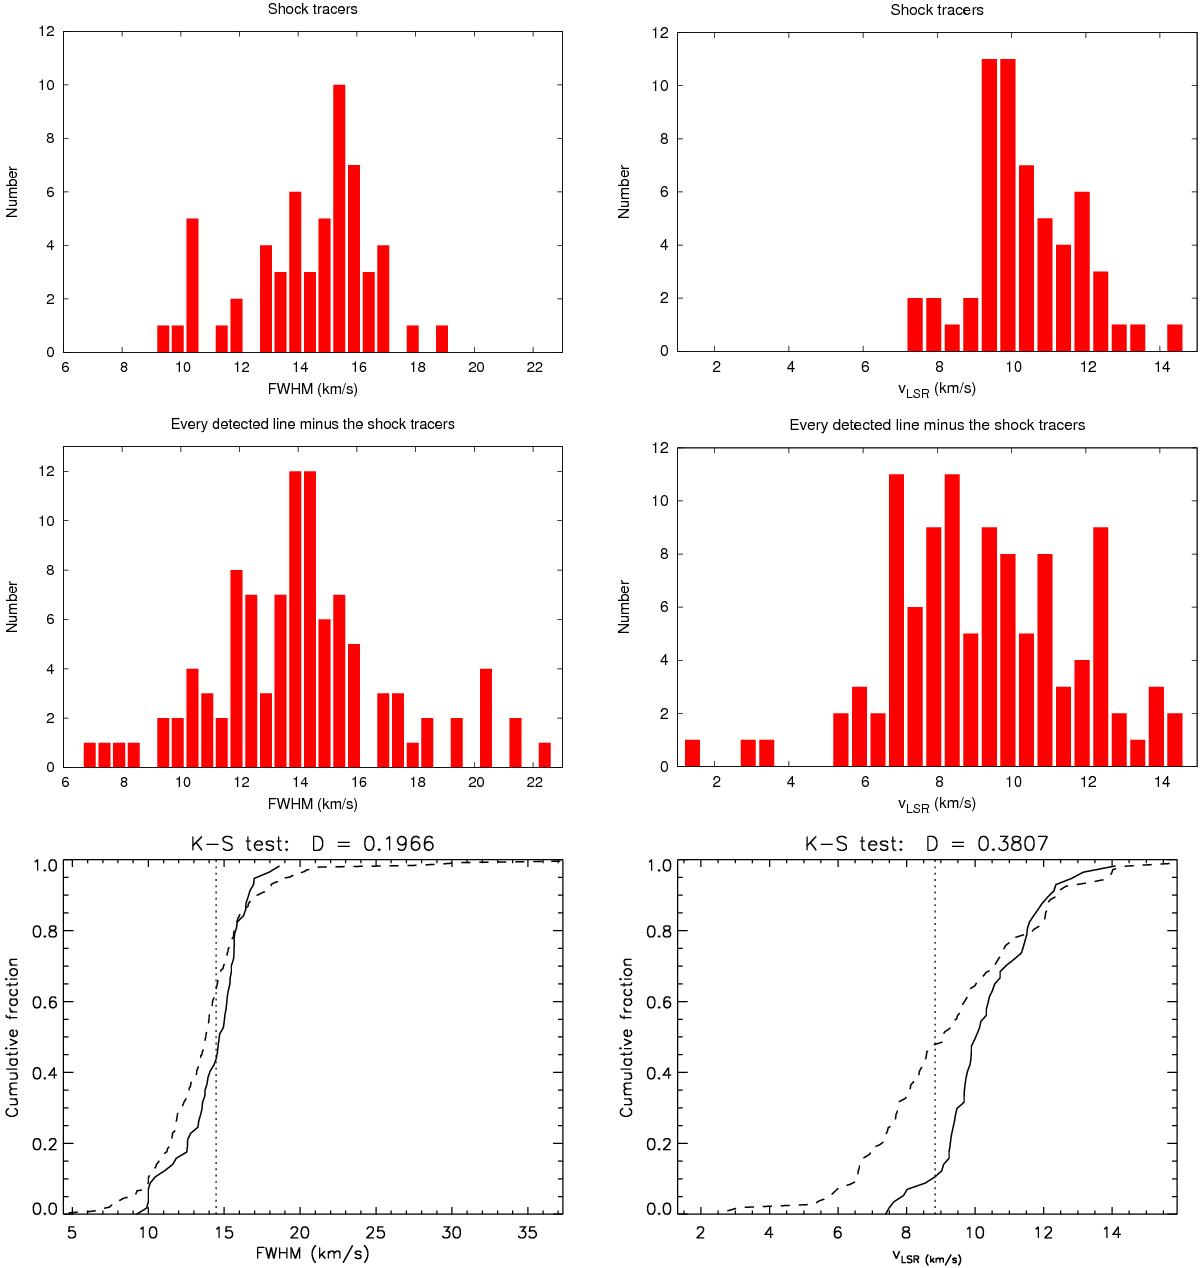
Top: distribution of the fitted line widths (left) and peak velocities (right) of the lines corresponding to molecules classified as “shock tracers”. Middle: distribution of the fitted line widths (left) and peak velocities (right) of every detected line in the line survey, except for the double-peaked and very asymmetric line profiles and the shock tracers shown above. Bottom: K-S test for the line width (left) and peak velocity (right) distributions shown above, corresponding to shock tracers only and to every other molecule that is not classified as a shock tracer. The parameter D is the maximum distance between the cumulative fraction of the shock tracers and the whole sample of lines and is related to the probability of a difference between the distributions. The part of the vertical dotted lines between the two distributions is equivalent to the D parameter.
Current usage metrics show cumulative count of Article Views (full-text article views including HTML views, PDF and ePub downloads, according to the available data) and Abstracts Views on Vision4Press platform.
Data correspond to usage on the plateform after 2015. The current usage metrics is available 48-96 hours after online publication and is updated daily on week days.
Initial download of the metrics may take a while.