Fig. 13
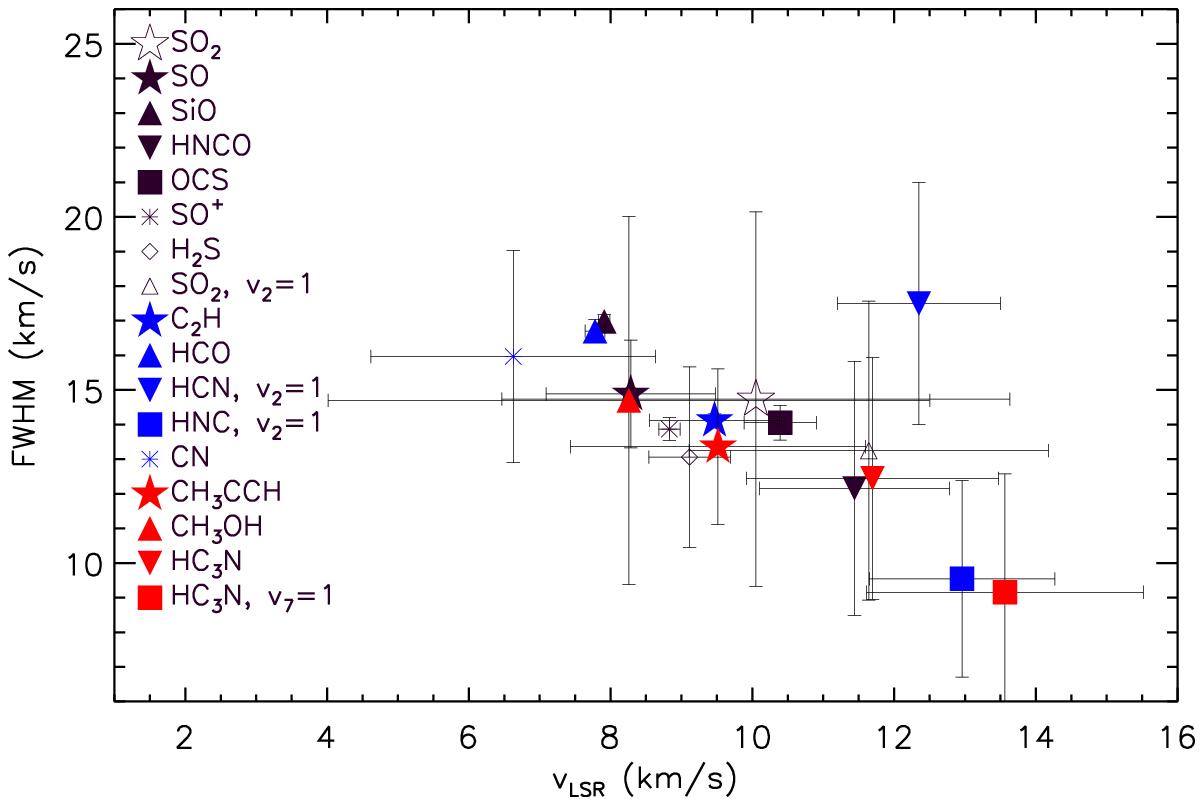
Measured line widths vs. peak velocities of species detected toward the W49A center. The molecules classified as shock tracers are shown in black, the molecules classified as PDR tracers are shown in blue, and the molecules classified as complex organic molecules are shown in red. Molecules with double-peaked line profiles are not included in this plot.
Current usage metrics show cumulative count of Article Views (full-text article views including HTML views, PDF and ePub downloads, according to the available data) and Abstracts Views on Vision4Press platform.
Data correspond to usage on the plateform after 2015. The current usage metrics is available 48-96 hours after online publication and is updated daily on week days.
Initial download of the metrics may take a while.