Free Access
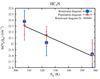
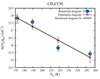
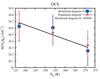
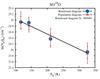
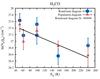
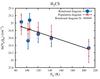
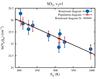
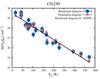
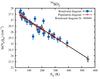
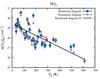
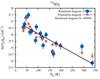
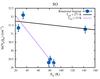
Fig. 12
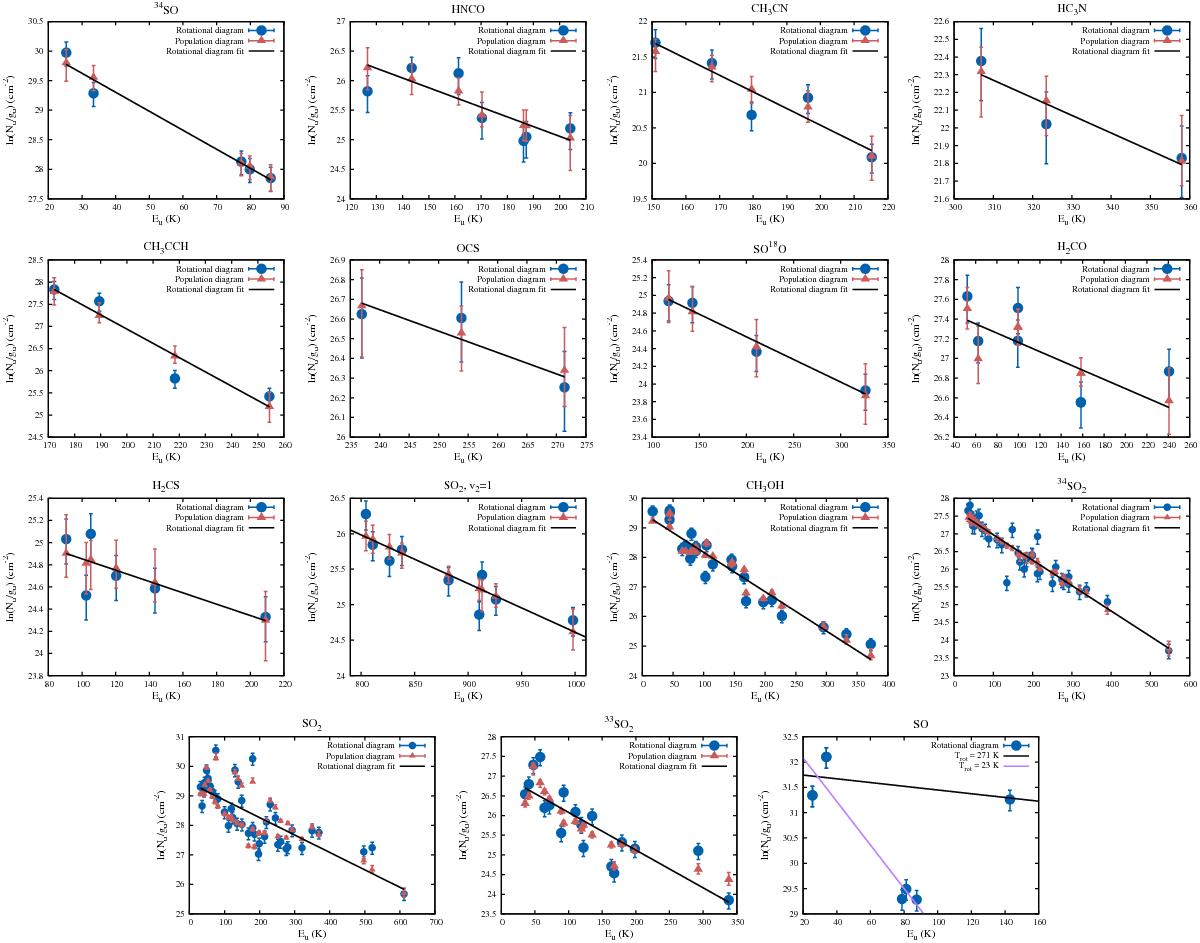
Rotation and population diagram plots toward the center. For CH3OH, H2CO, and SO2, the transitions from the high-frequency extension of the SLS (between 360–373 GHz) were originally analyzed in Nagy et al. (2012).
This figure is made of several images, please see below:
Current usage metrics show cumulative count of Article Views (full-text article views including HTML views, PDF and ePub downloads, according to the available data) and Abstracts Views on Vision4Press platform.
Data correspond to usage on the plateform after 2015. The current usage metrics is available 48-96 hours after online publication and is updated daily on week days.
Initial download of the metrics may take a while.