Fig. 5
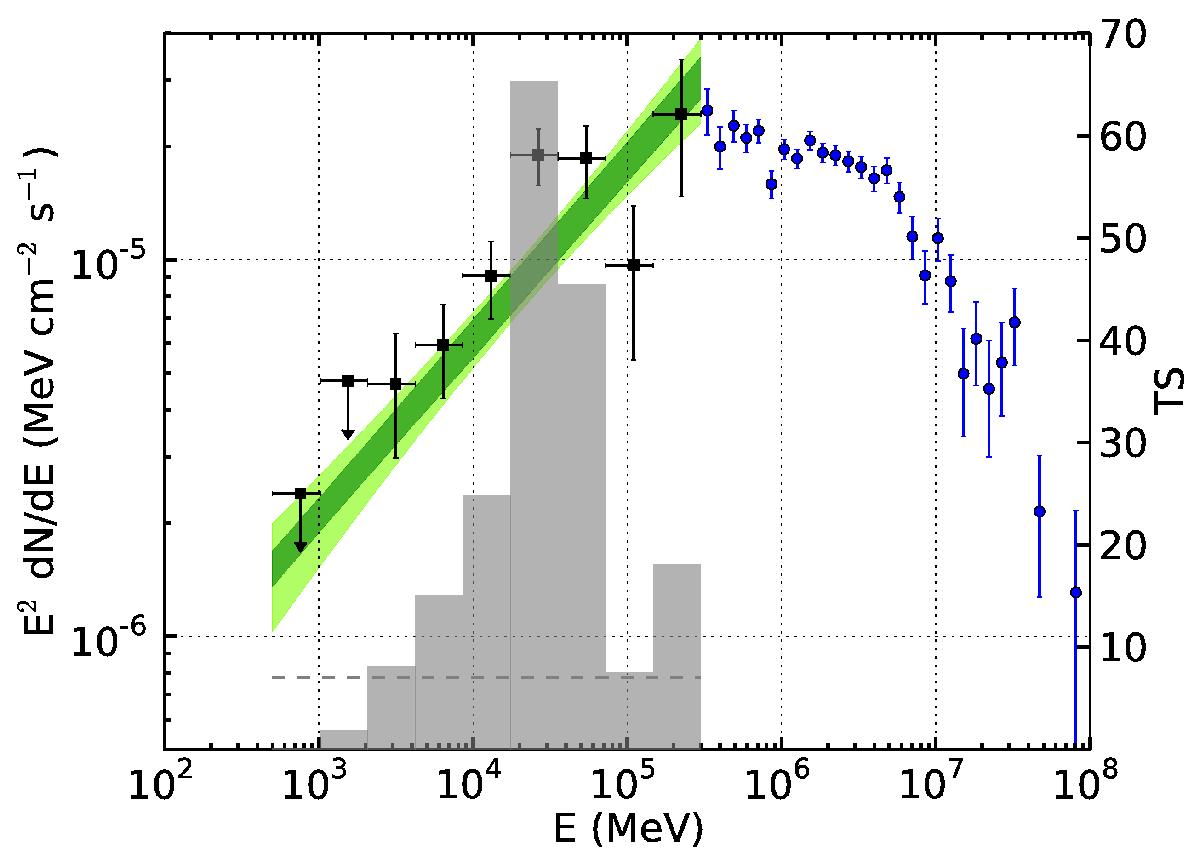
Broadband γ-ray spectrum of RX J1713.7–3946 as measured here (black points) and by HESS (blue points). The two bow tie bands denote systematic (dark green) and total (light green) uncertainties of the single power-law fit, the latter assuming that systematic and statistical uncertainties can be added in quadrature. The histogram indicates the TS value for each energy bin. The dotted line is the threshold for setting a 95% confident level upper limit.
Current usage metrics show cumulative count of Article Views (full-text article views including HTML views, PDF and ePub downloads, according to the available data) and Abstracts Views on Vision4Press platform.
Data correspond to usage on the plateform after 2015. The current usage metrics is available 48-96 hours after online publication and is updated daily on week days.
Initial download of the metrics may take a while.