Fig. 3
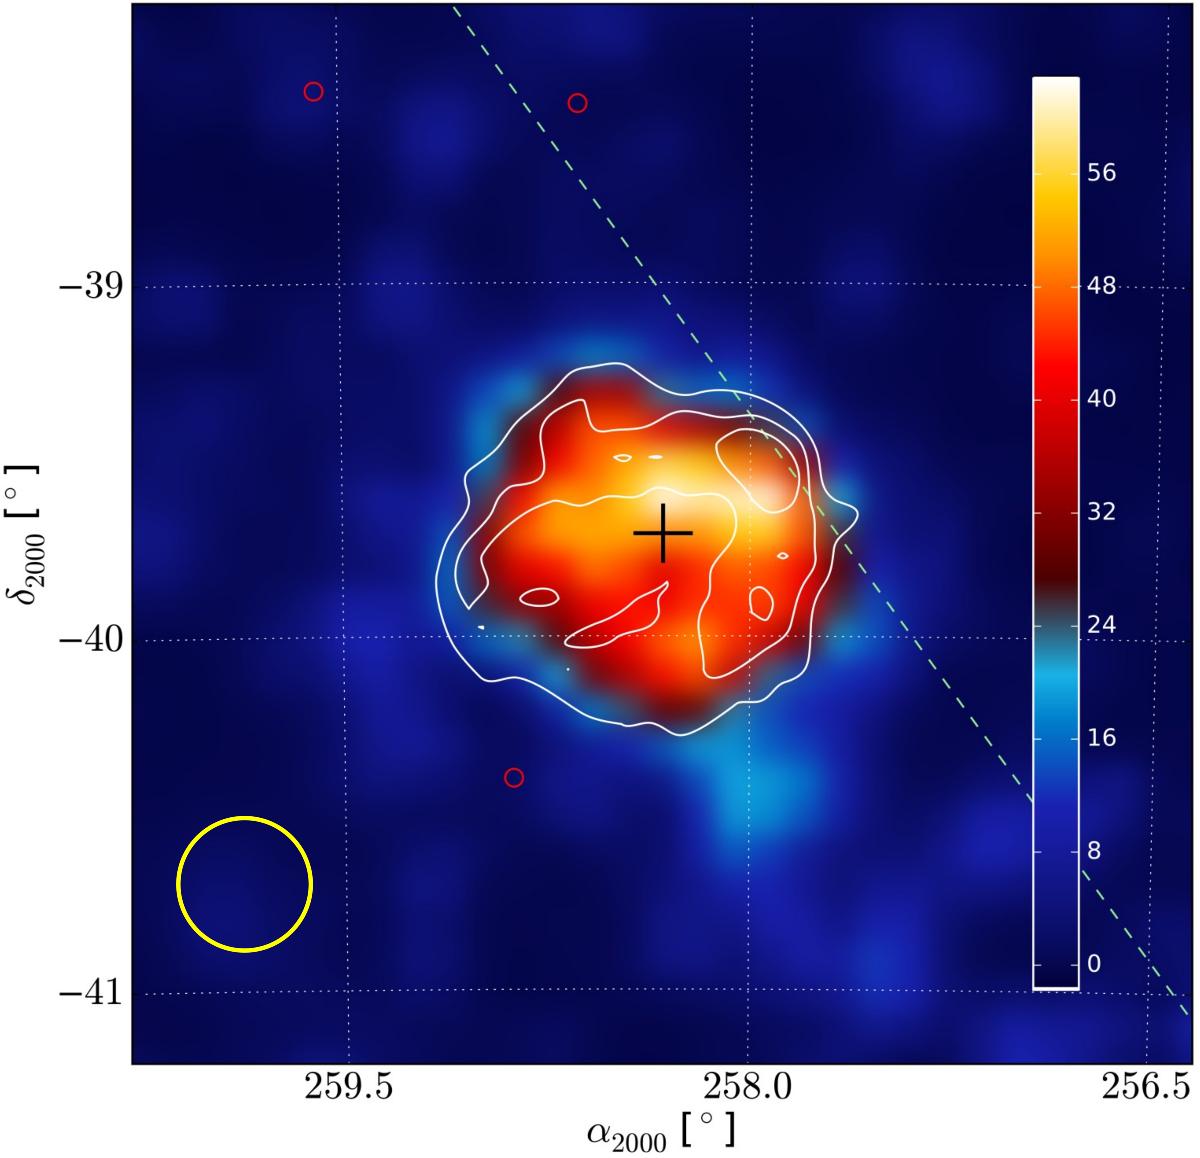
Map of the test statistic (TS) for a point-like source in the region around RX J1713.7–3946. The black cross denotes the best-fit centroid of a disk model and the yellow circle indicates the energy-averaged 68% confinement region of the point-spread function. Red circles indicate the position of the second Fermi-LAT catalog sources in the background model. Shown in white are contours of γ-ray excess counts based on HESS observations, the levels are 25, 50, and 75.
Current usage metrics show cumulative count of Article Views (full-text article views including HTML views, PDF and ePub downloads, according to the available data) and Abstracts Views on Vision4Press platform.
Data correspond to usage on the plateform after 2015. The current usage metrics is available 48-96 hours after online publication and is updated daily on week days.
Initial download of the metrics may take a while.