Free Access
Fig. 8
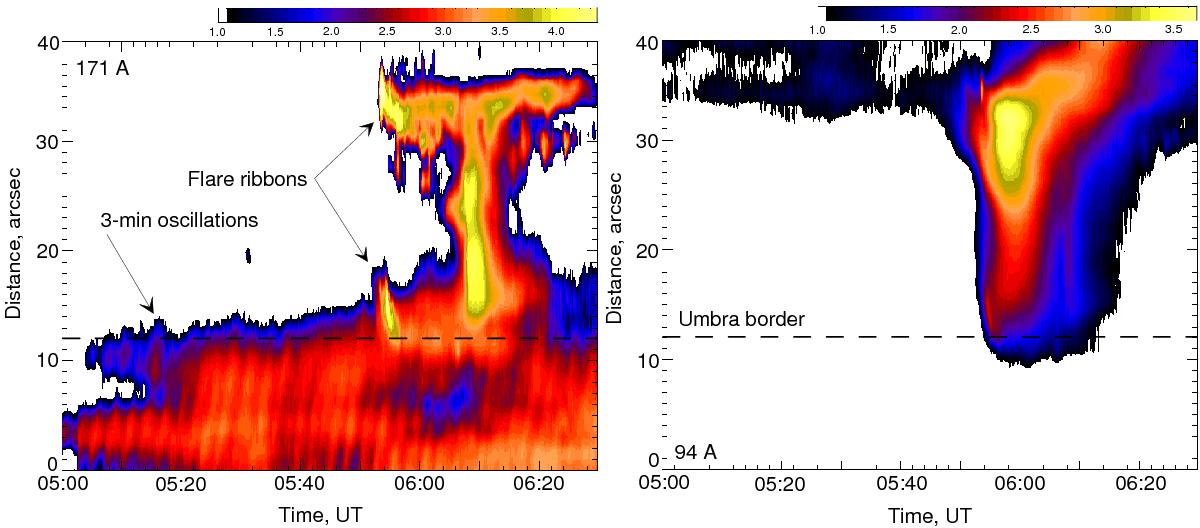
Time–distance plots of flare region in 171 Å (left panel) and 94 Å (right panel) (SDO/AIA). In the left panel, in its bottom part, corresponding to the umbra region, there is a periodical structure of inclined wakes showing the 3-min oscillations in UV range.
Current usage metrics show cumulative count of Article Views (full-text article views including HTML views, PDF and ePub downloads, according to the available data) and Abstracts Views on Vision4Press platform.
Data correspond to usage on the plateform after 2015. The current usage metrics is available 48-96 hours after online publication and is updated daily on week days.
Initial download of the metrics may take a while.