Free Access
Fig. 6
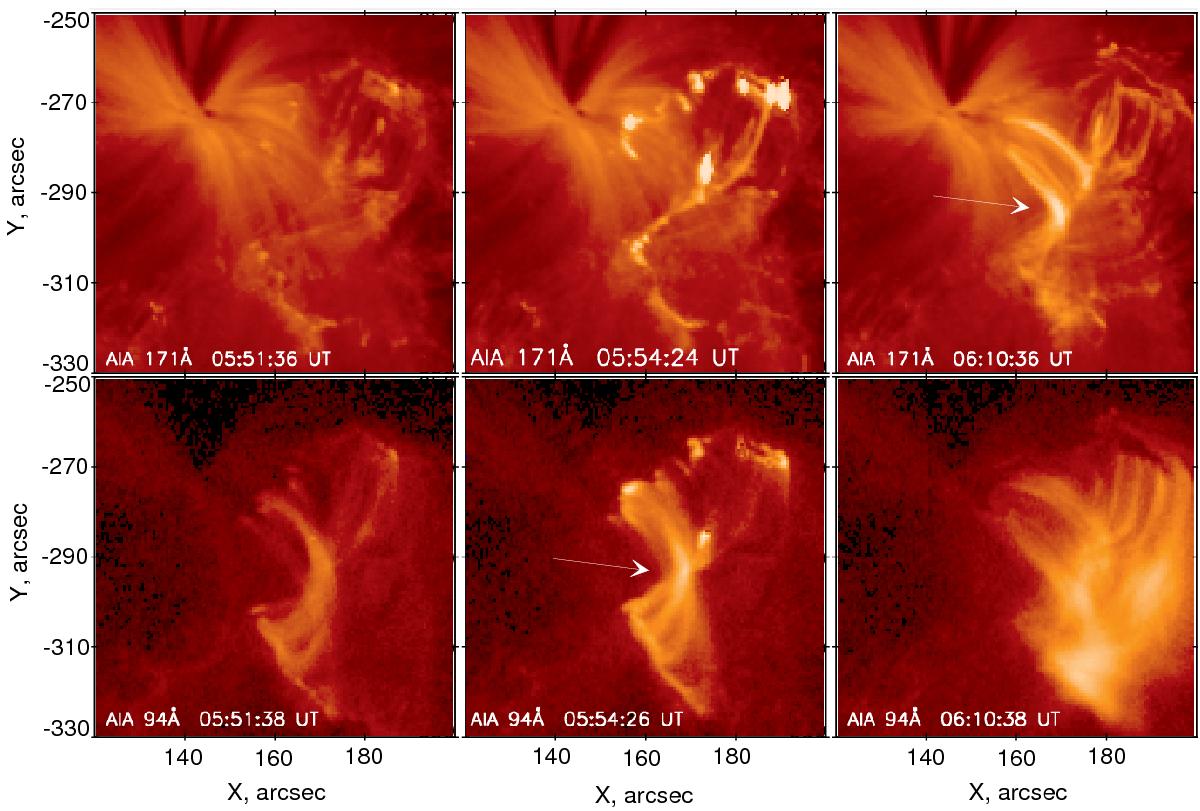
Flare loop evolution in the 171 Å (upper row) and 94 Å (bottom row) lines during the 2012 June 7 flare at three times: 05:51:36 (:38), 05:54:24 (:26), and 06:10:36 (:38) UT. The arrows show the location of changing magnetic field structure (from sheared to a near-potential one), see the plots at 05:54:26 and 06:10:36 UT.
Current usage metrics show cumulative count of Article Views (full-text article views including HTML views, PDF and ePub downloads, according to the available data) and Abstracts Views on Vision4Press platform.
Data correspond to usage on the plateform after 2015. The current usage metrics is available 48-96 hours after online publication and is updated daily on week days.
Initial download of the metrics may take a while.