Fig. 4
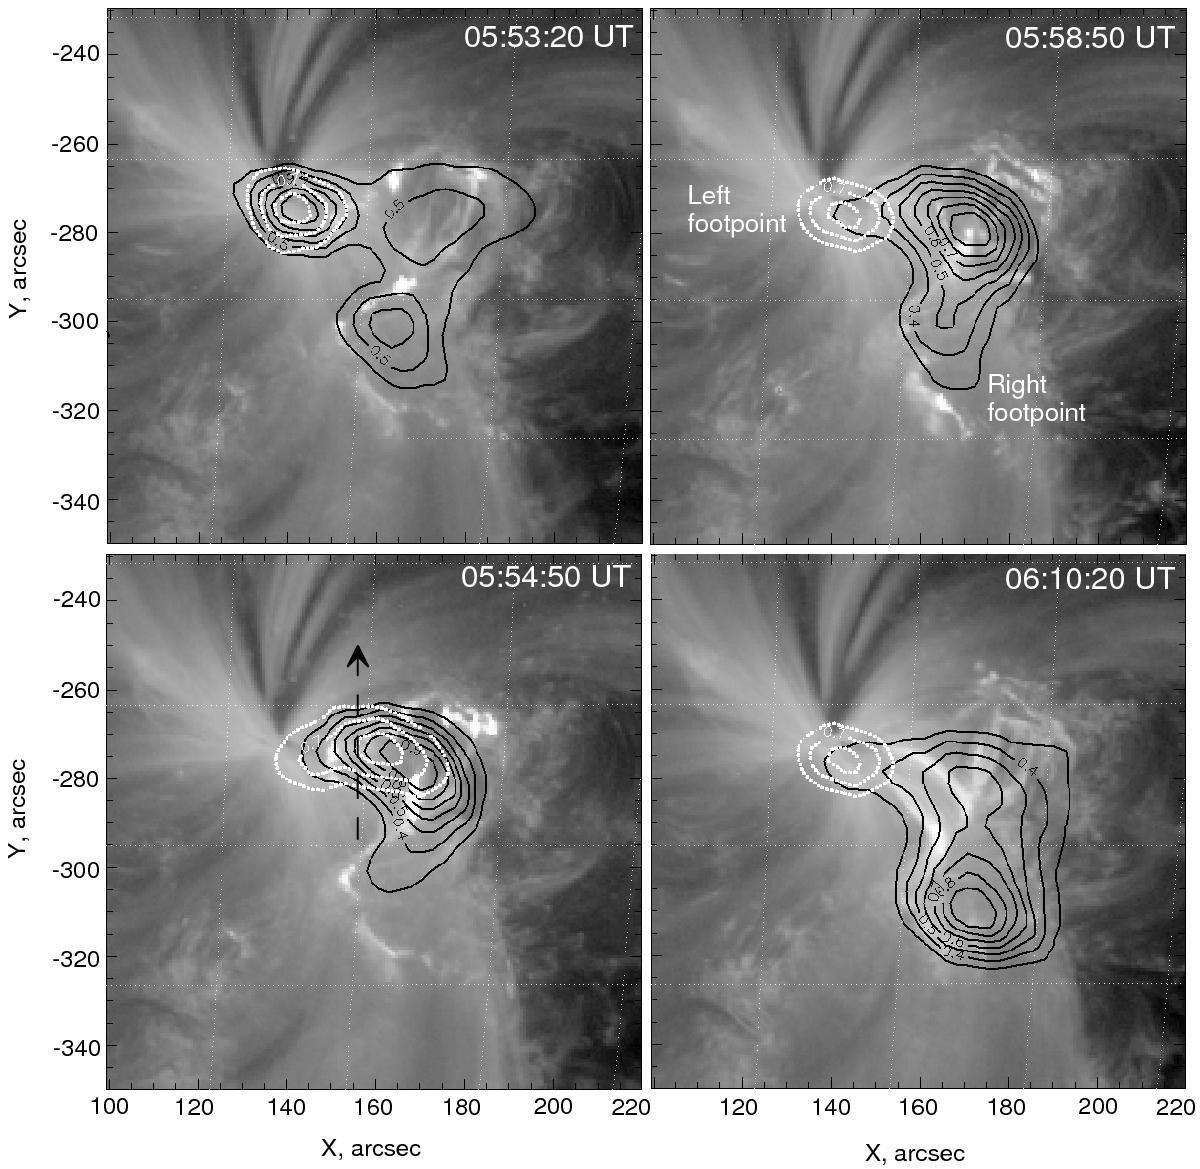
Temporal evolution of the microwave burst (NoRH, 17 GHz) observed during the 2012 June 7 flare. The black solid lines and the white dotted lines corresponds to the intensity in maximum levels and polarization in levels of minimum intensity, respectively. The background is an AIA 171 Å image. The arrow shows the path of scans for the time-distance plot.
Current usage metrics show cumulative count of Article Views (full-text article views including HTML views, PDF and ePub downloads, according to the available data) and Abstracts Views on Vision4Press platform.
Data correspond to usage on the plateform after 2015. The current usage metrics is available 48-96 hours after online publication and is updated daily on week days.
Initial download of the metrics may take a while.