Fig. 3
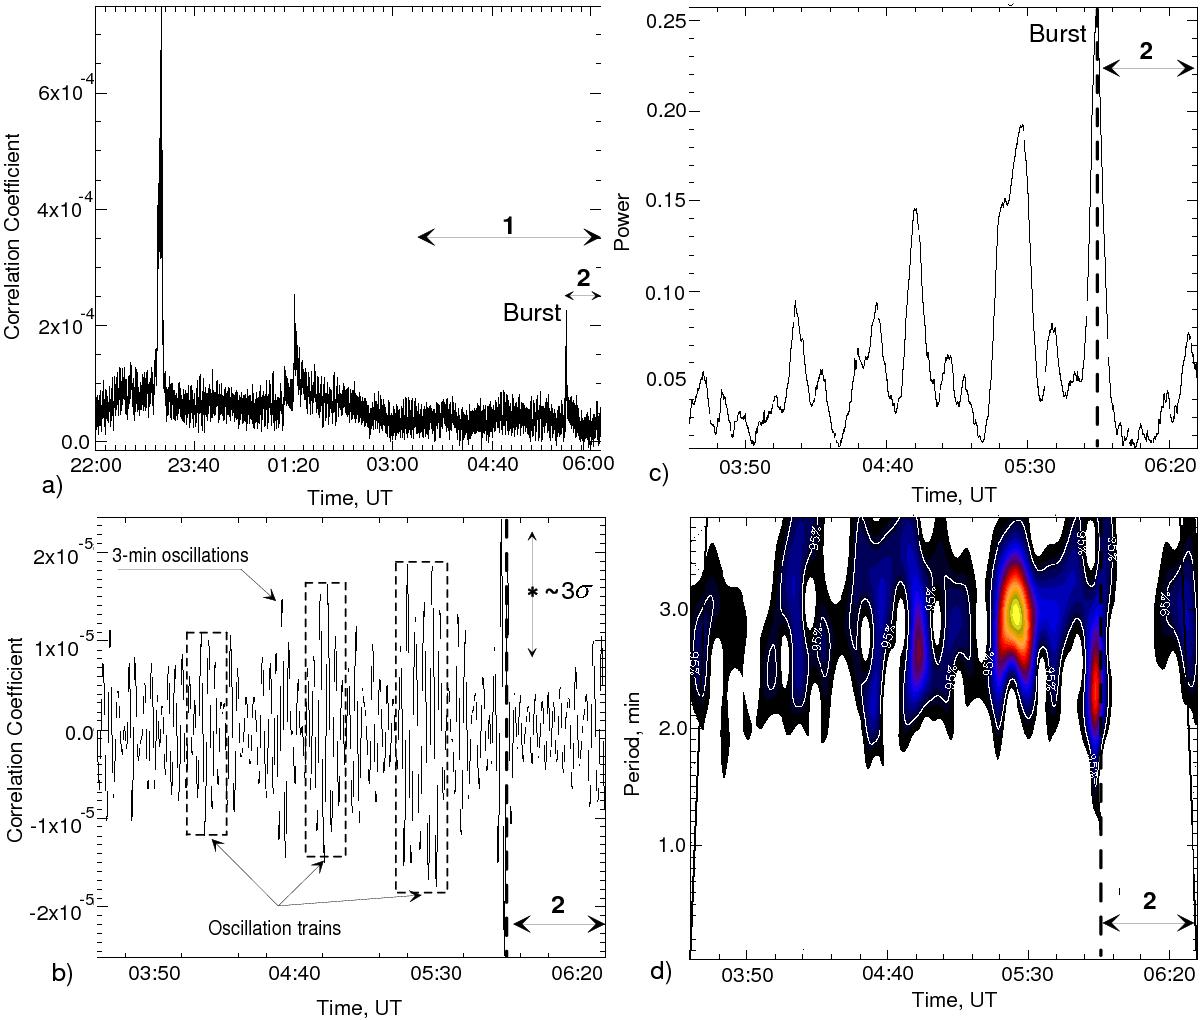
a) Correlation curve for the polarization channel (NoRH, 17 GHz) during daytime observations. The horizontal lines shows the interval before the flare (burst) at 03:30–05:55 UT (1) and at the post-flare stage, at 05:55–06:30 UT (2). b) 3-min variation of correlation coefficients with removed low-frequency trend. The 3σ error bar is added. c) Power variation of correlation coefficients centred at 3-min period. d) Wavelet power spectrum of oscillations. The flare (burst) maximum is shown by vertical broken line.
Current usage metrics show cumulative count of Article Views (full-text article views including HTML views, PDF and ePub downloads, according to the available data) and Abstracts Views on Vision4Press platform.
Data correspond to usage on the plateform after 2015. The current usage metrics is available 48-96 hours after online publication and is updated daily on week days.
Initial download of the metrics may take a while.