Free Access
Fig. 1
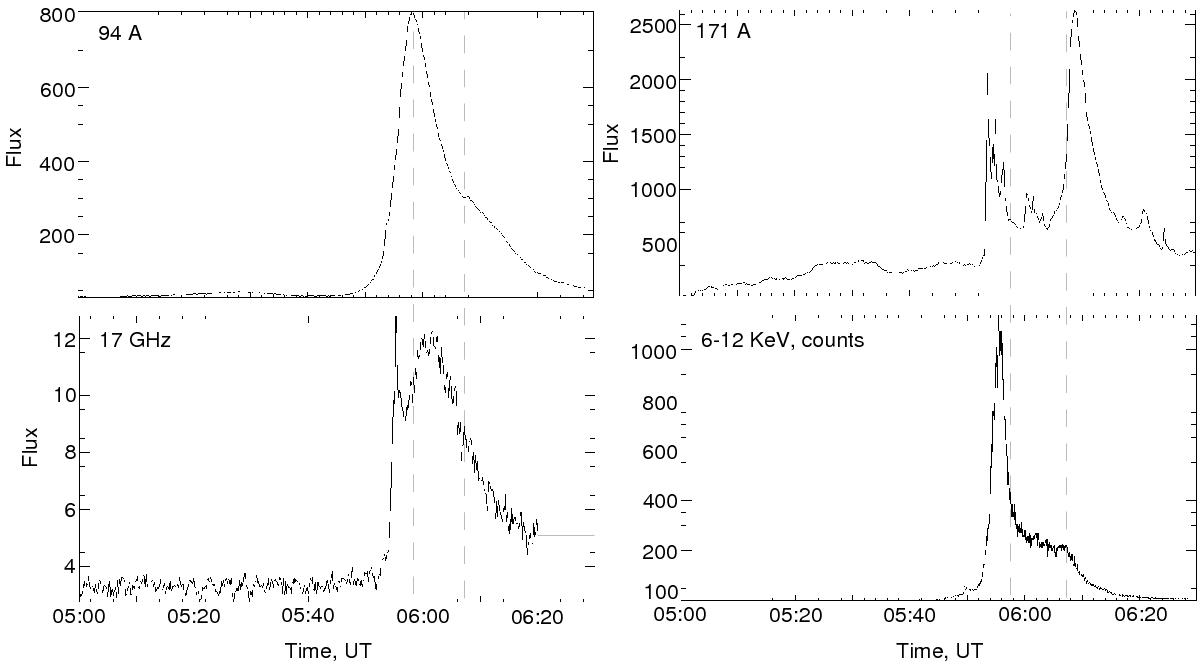
Light curves of the 2012 June 7 flare in EUV channels (SDO/AIA, 94 Å and 171 Å), radio (NoRH, 17 GHz) and X-ray (RHESI, 6–12 keV). The flat stage is shown by vertical dashed lines 05:58–06:08 UT.
Current usage metrics show cumulative count of Article Views (full-text article views including HTML views, PDF and ePub downloads, according to the available data) and Abstracts Views on Vision4Press platform.
Data correspond to usage on the plateform after 2015. The current usage metrics is available 48-96 hours after online publication and is updated daily on week days.
Initial download of the metrics may take a while.