Fig. 7
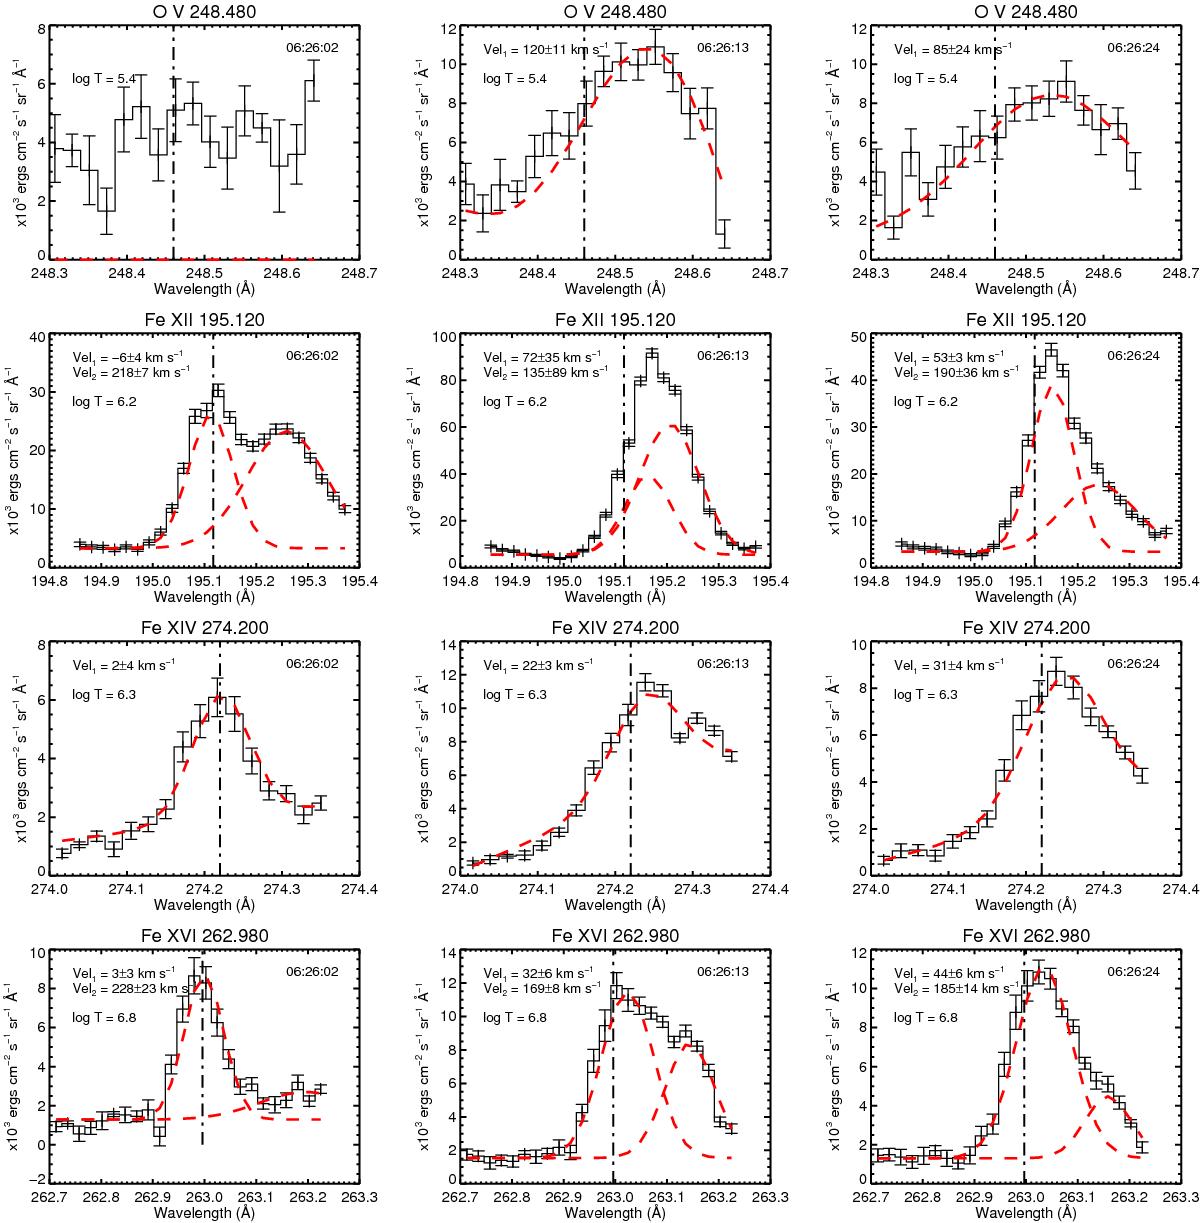
Fitted EIS spectra across the coronal source, as for the same positions in Figs. 5a–c, at various temperatures. The vertical dashed-dotted line marks the rest wavelength determined from the quiet background. The rest wavelength of each ion, formation temperature and velocity of the red-shifted components are indicated in each panel.
Current usage metrics show cumulative count of Article Views (full-text article views including HTML views, PDF and ePub downloads, according to the available data) and Abstracts Views on Vision4Press platform.
Data correspond to usage on the plateform after 2015. The current usage metrics is available 48-96 hours after online publication and is updated daily on week days.
Initial download of the metrics may take a while.