Fig. 6
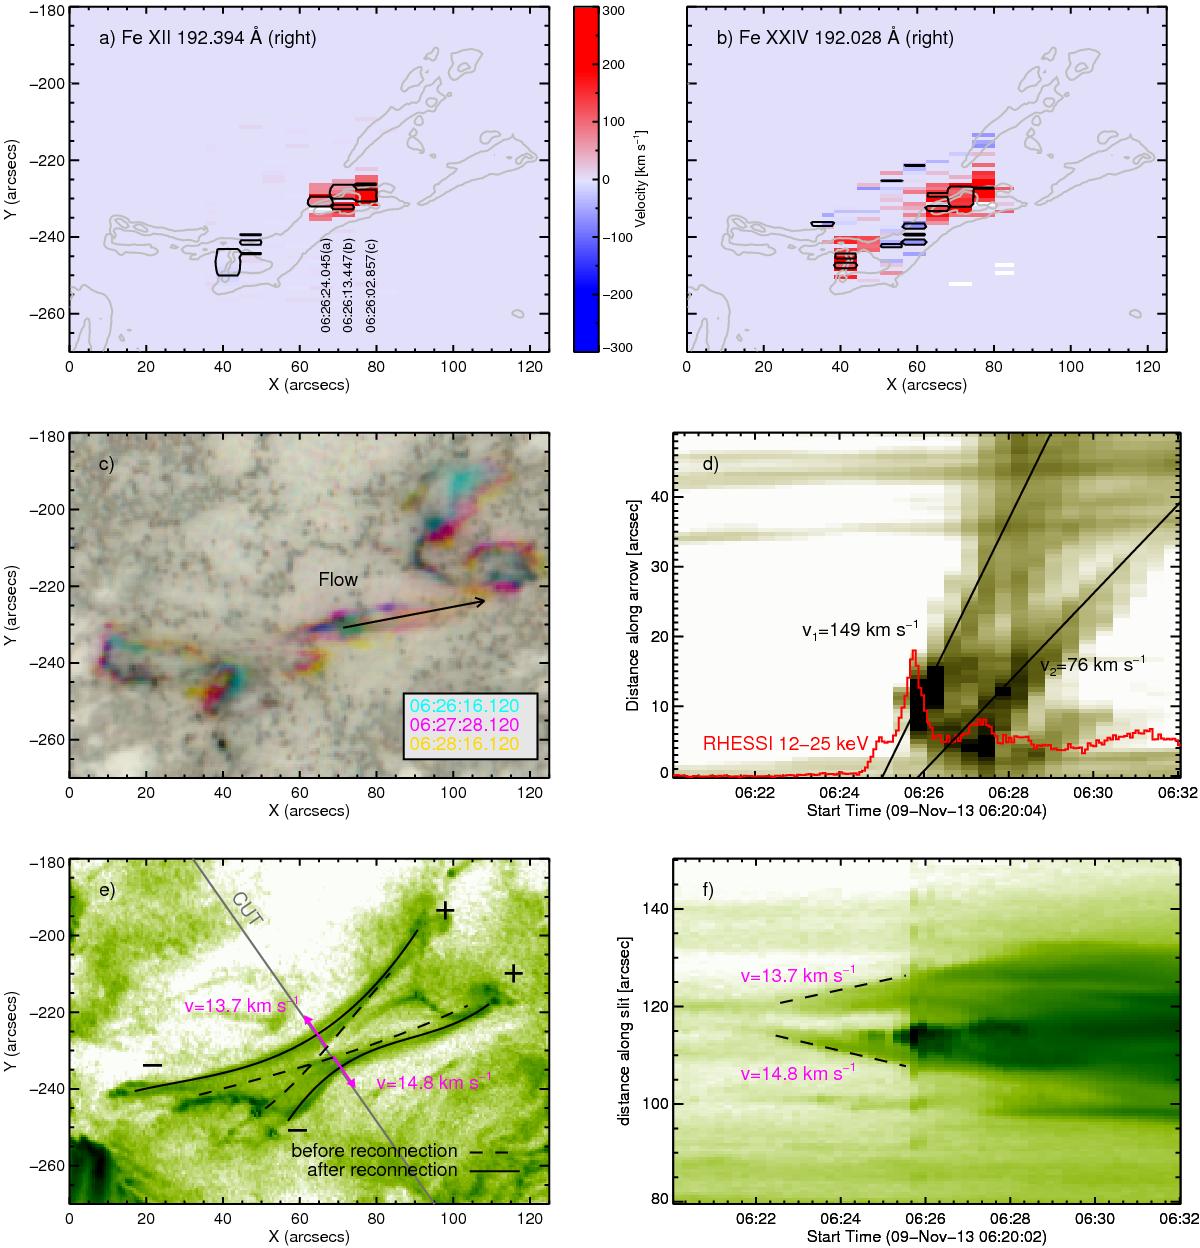
a) Hinode/EIS velocity maps of the red-shifed right component of Fe xii; and b) Fe xxiv, overlaid with black contours at 30% of the maximum intensity and SDO/AIA 131 Å contours (in grey) for reference; c) colour-coded time evolution of SDO/AIA 1600 Å images showing plasma flows; d) time-slice diagram along the arrow in c), showing two outflows, originating at the coronal source, associated with RHESSI 12–25 keV peaks; e) representation of pre- and post-reconnection field lines; f) time-slice diagram along the slit in a) and estimates of the retraction speed of the post-reconnected field.
Current usage metrics show cumulative count of Article Views (full-text article views including HTML views, PDF and ePub downloads, according to the available data) and Abstracts Views on Vision4Press platform.
Data correspond to usage on the plateform after 2015. The current usage metrics is available 48-96 hours after online publication and is updated daily on week days.
Initial download of the metrics may take a while.