Fig. 5
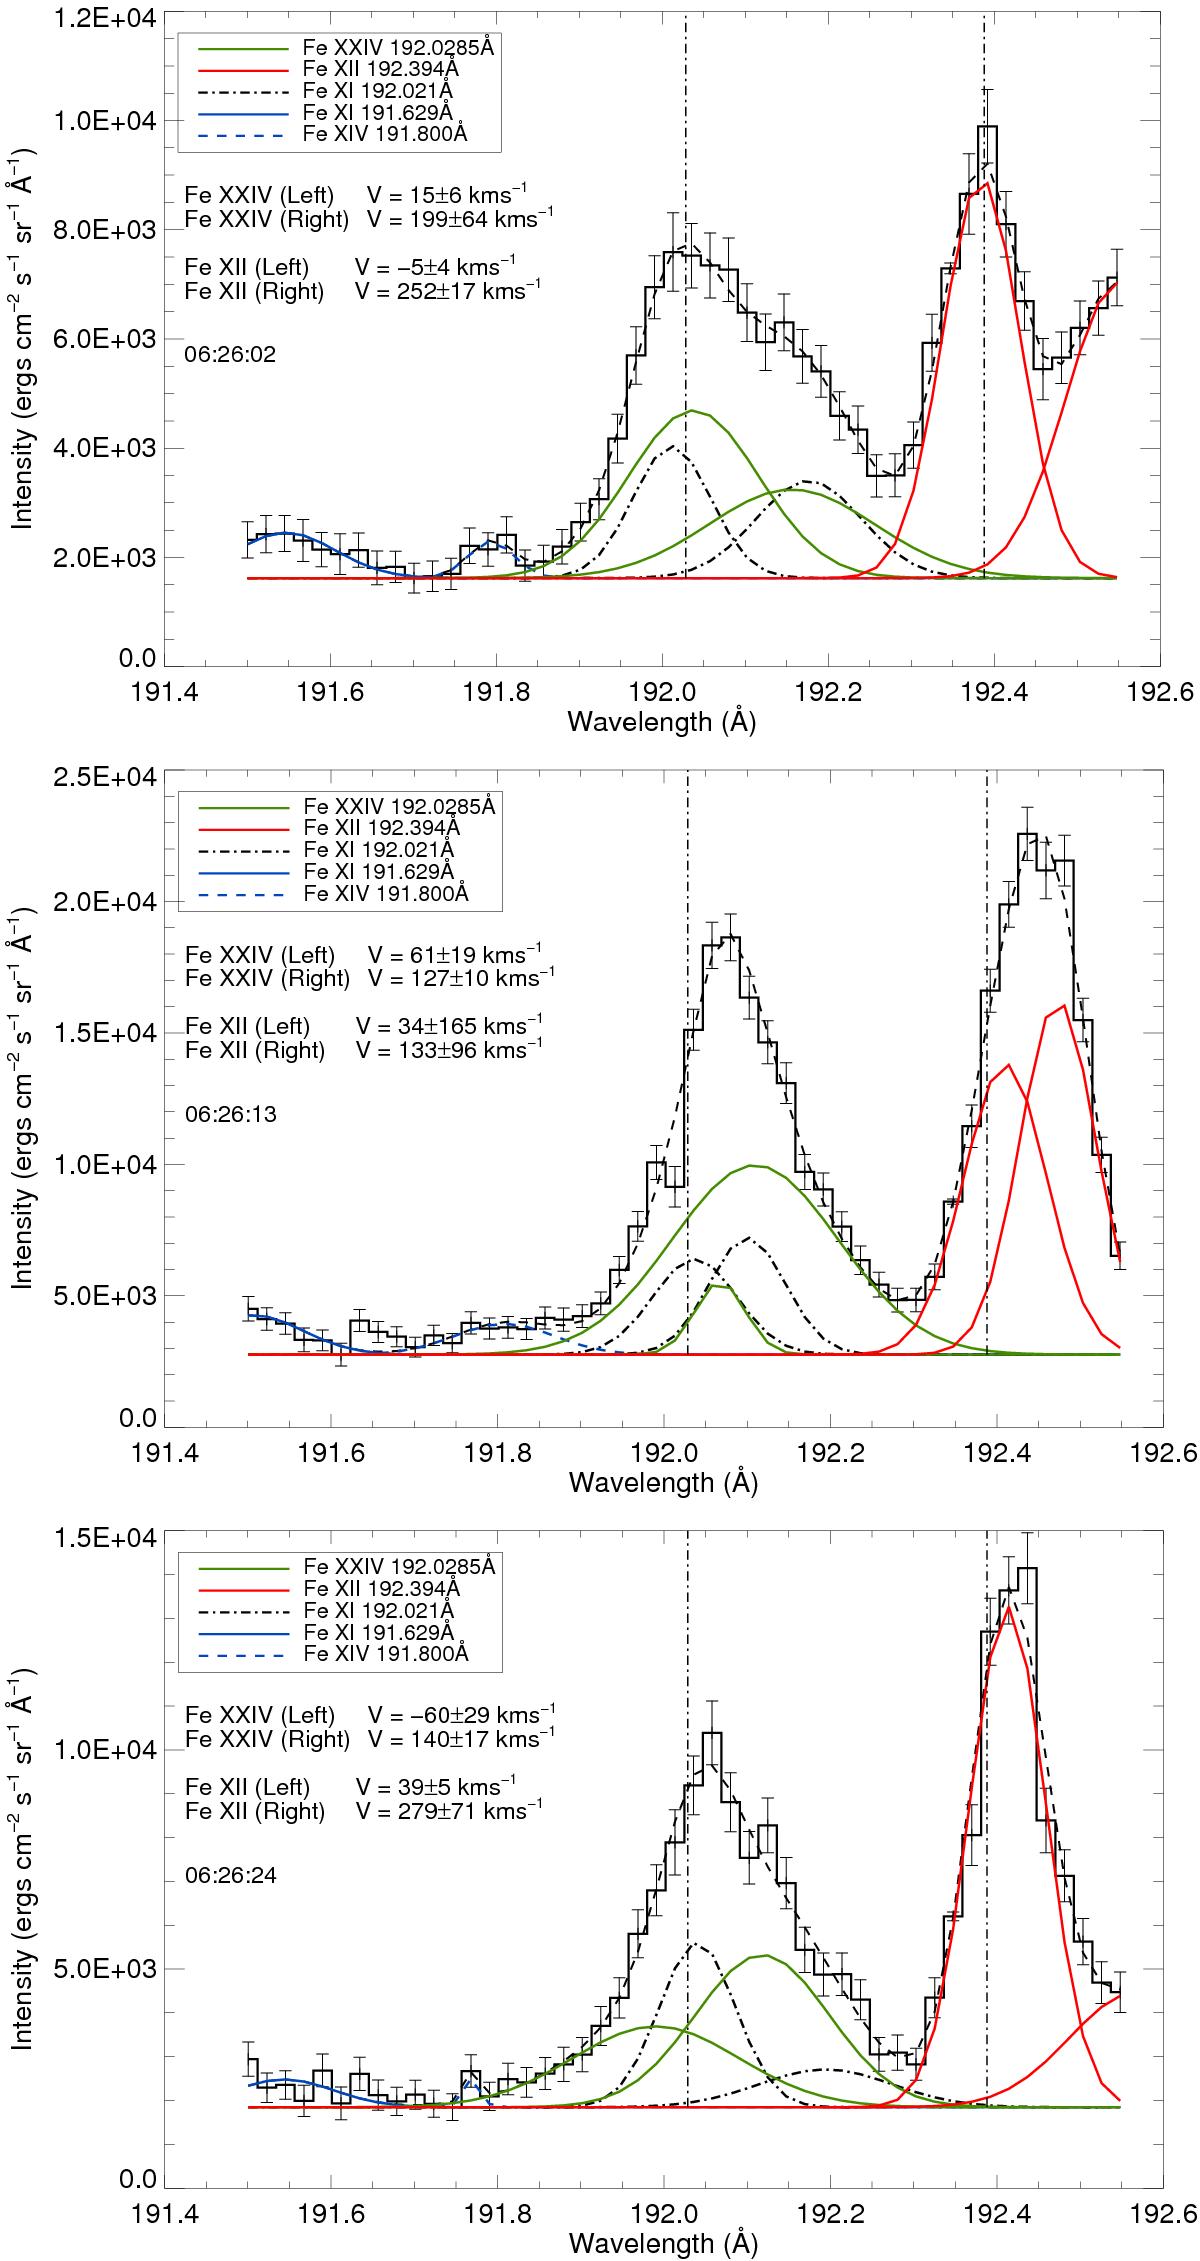
Fitted EIS spectra at three positions (and times) across the coronal source, as indicated in Fig. 6a. The specific intensity is shown in the solid black line, with the associated data uncertainty, and the dotted black line shows the total fit to the data. Two fitted Gaussian components for Fe xxiv are shown in green, for Fe xii in red, and the estimated blend of Fe xi in black (dash-dotted line). A vertical dash-dotted line marks the rest wavelength for the Fe xxiv 192.028 Å and Fe xii 192.394 Å lines, and Doppler velocities relative to these wavelengths for each fitted component are also shown.
Current usage metrics show cumulative count of Article Views (full-text article views including HTML views, PDF and ePub downloads, according to the available data) and Abstracts Views on Vision4Press platform.
Data correspond to usage on the plateform after 2015. The current usage metrics is available 48-96 hours after online publication and is updated daily on week days.
Initial download of the metrics may take a while.