Fig. 3
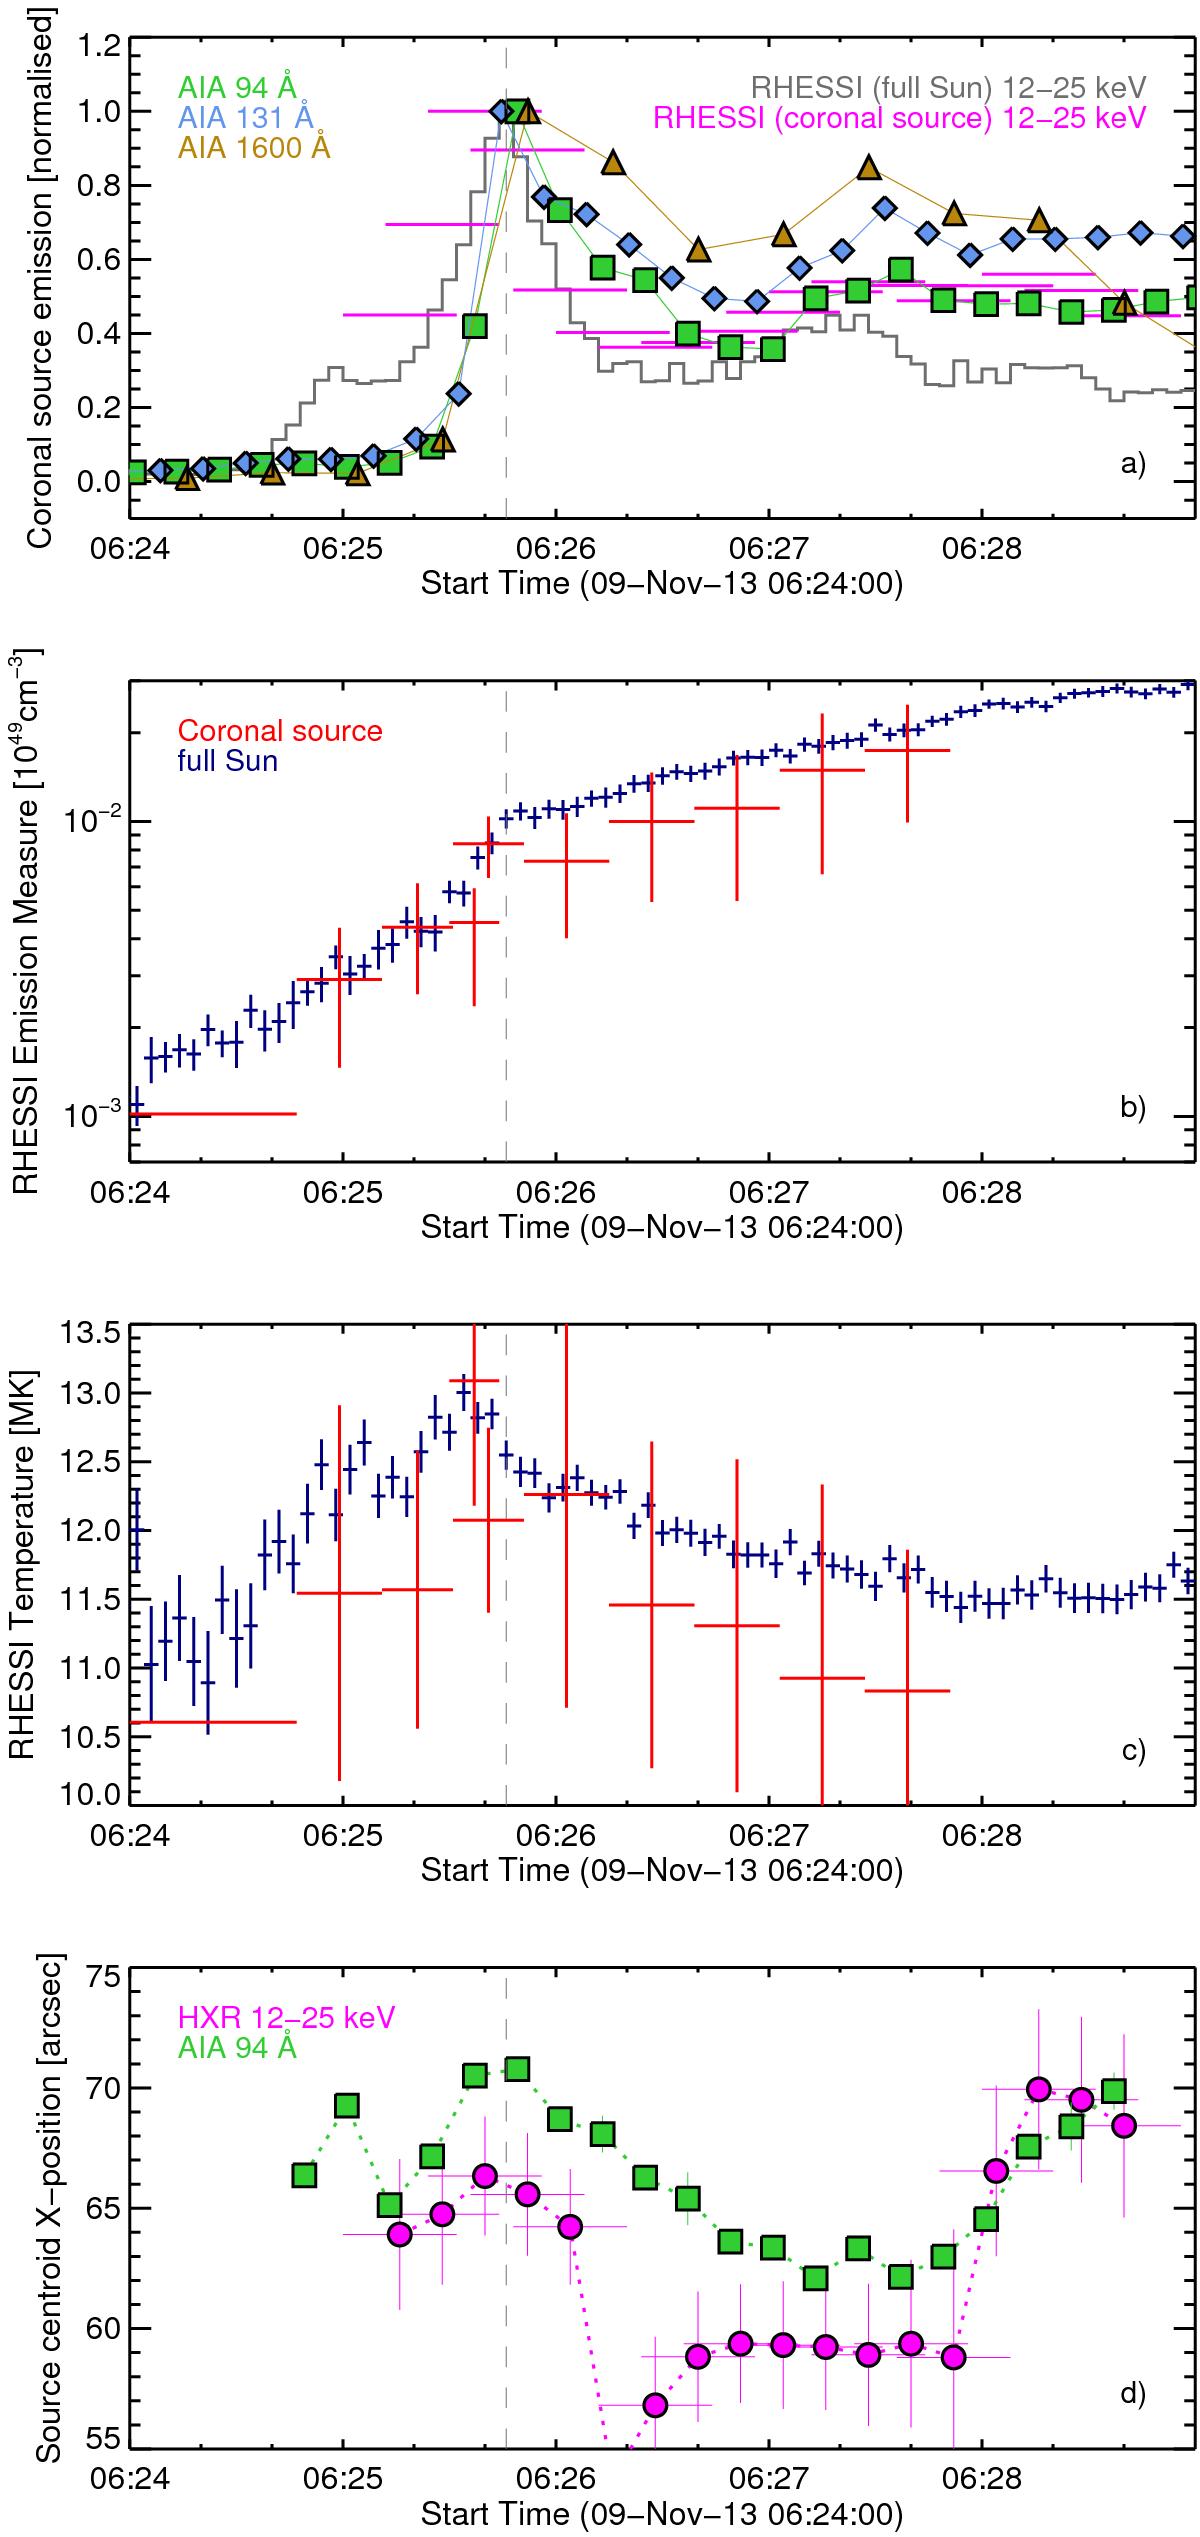
a) Normalised coronal source (box in Fig. 1a) emission at EUV 94 (green squares) and 131 Å (blue diamonds), UV 1600 Å (yellow triangles), HXR at 12–25 keV (magenta horizontal lines) from RHESSI images, with the horizontal length of the lines indicating the time interval of the image. Full Sun HXR 12-25 keV (dark grey) from RHESSI is also shown for reference; b) RHESSI emission measure (EM, cm-3); and c) temperature (T, MK) from the isothermal model for spatially unresolved (full Sun) (dark blue) and from imaging spectroscopy analysis for the coronal source (red). Vertical bars show the uncertainty from the fit and horizontal bars the time integration interval. In all panels, the vertical dashed line indicates the peak time of the HXR emission above 12 keV; d) positions (in solar X-direction) of the coronal source centroid measured from SDO/AIA 94 Å and RHESSI 12–25 keV images. Horizontal bars indicate the time integration and vertical bars show a rough estimate of the uncertainties of the HXR centroid.
Current usage metrics show cumulative count of Article Views (full-text article views including HTML views, PDF and ePub downloads, according to the available data) and Abstracts Views on Vision4Press platform.
Data correspond to usage on the plateform after 2015. The current usage metrics is available 48-96 hours after online publication and is updated daily on week days.
Initial download of the metrics may take a while.