Fig. 1
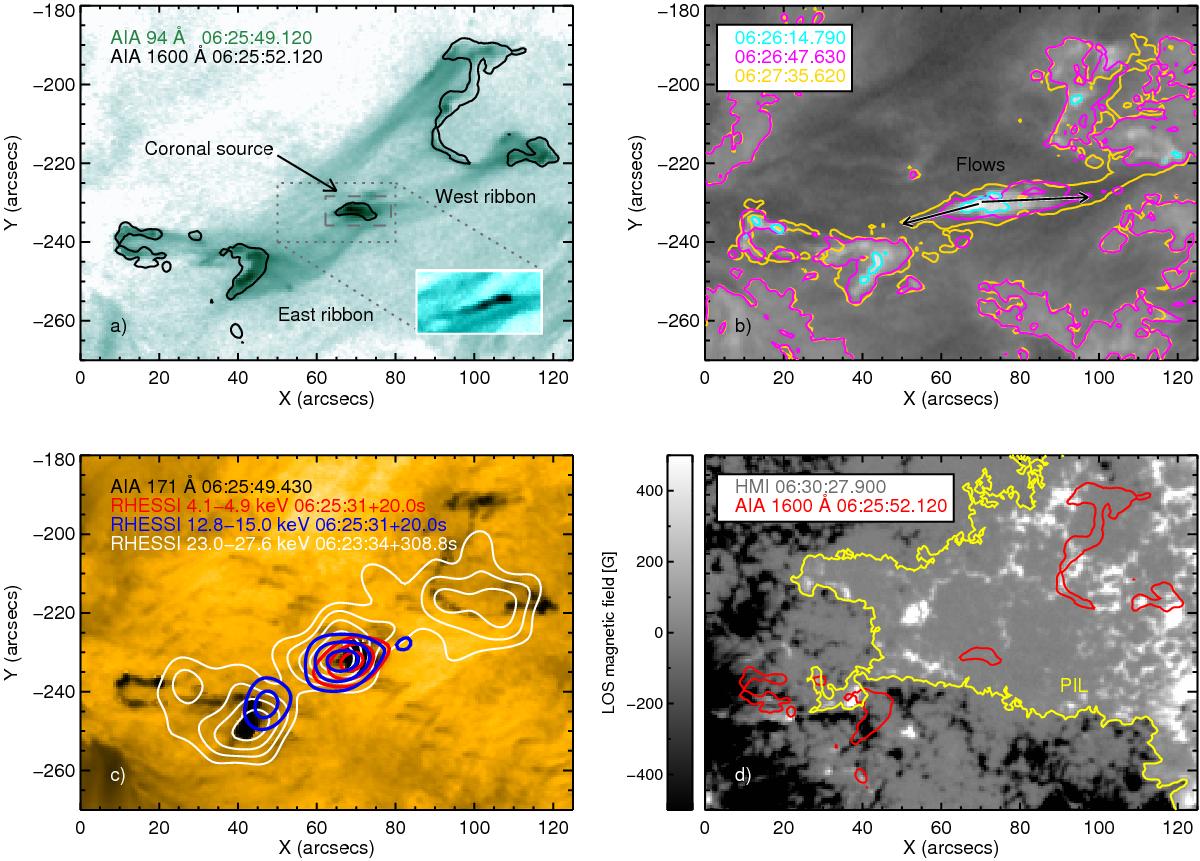
a) SDO/AIA 94 Å image (in inverted colours) overlaid with 1600 Å contours at 690 DN s-1 pixel-1 near the peak of the impulsive phase, showing the east and west flaring ribbons and the bright coronal source between them, indicated by the arrow. The inner frame shows the filamentary shape of the coronal source at 131 Å (at 06:25:20 UT); b) SDO/AIA 211 Å colour-coded contours time sequence of bi-directional flows away from the coronal source; c) SDO/AIA 171 Å image (in inverted colours) overlaid with RHESSI images at 4.1–4.9 keV (red) and 12.8–15.0 keV (blue) near the peak of the impulsive phase (integrated for 20 s), with contours at 50, 70 and 90% of the maximum of each image, and at 23–27 keV (white, levels 50, 60, 70, 80, 90% of the image maximum) integrated for ≈300 s, covering the entire main impulsive phase (time intervals indicated in the frame); d) SDO/HMI line-of-sight (LOS) magnetogram (saturated at ±500 G) overlaid with 1600 Å contours as in a), the yellow line shows the magnetic polarity inversion line. Times of each image are indicated in each frame.
Current usage metrics show cumulative count of Article Views (full-text article views including HTML views, PDF and ePub downloads, according to the available data) and Abstracts Views on Vision4Press platform.
Data correspond to usage on the plateform after 2015. The current usage metrics is available 48-96 hours after online publication and is updated daily on week days.
Initial download of the metrics may take a while.