Fig. 6
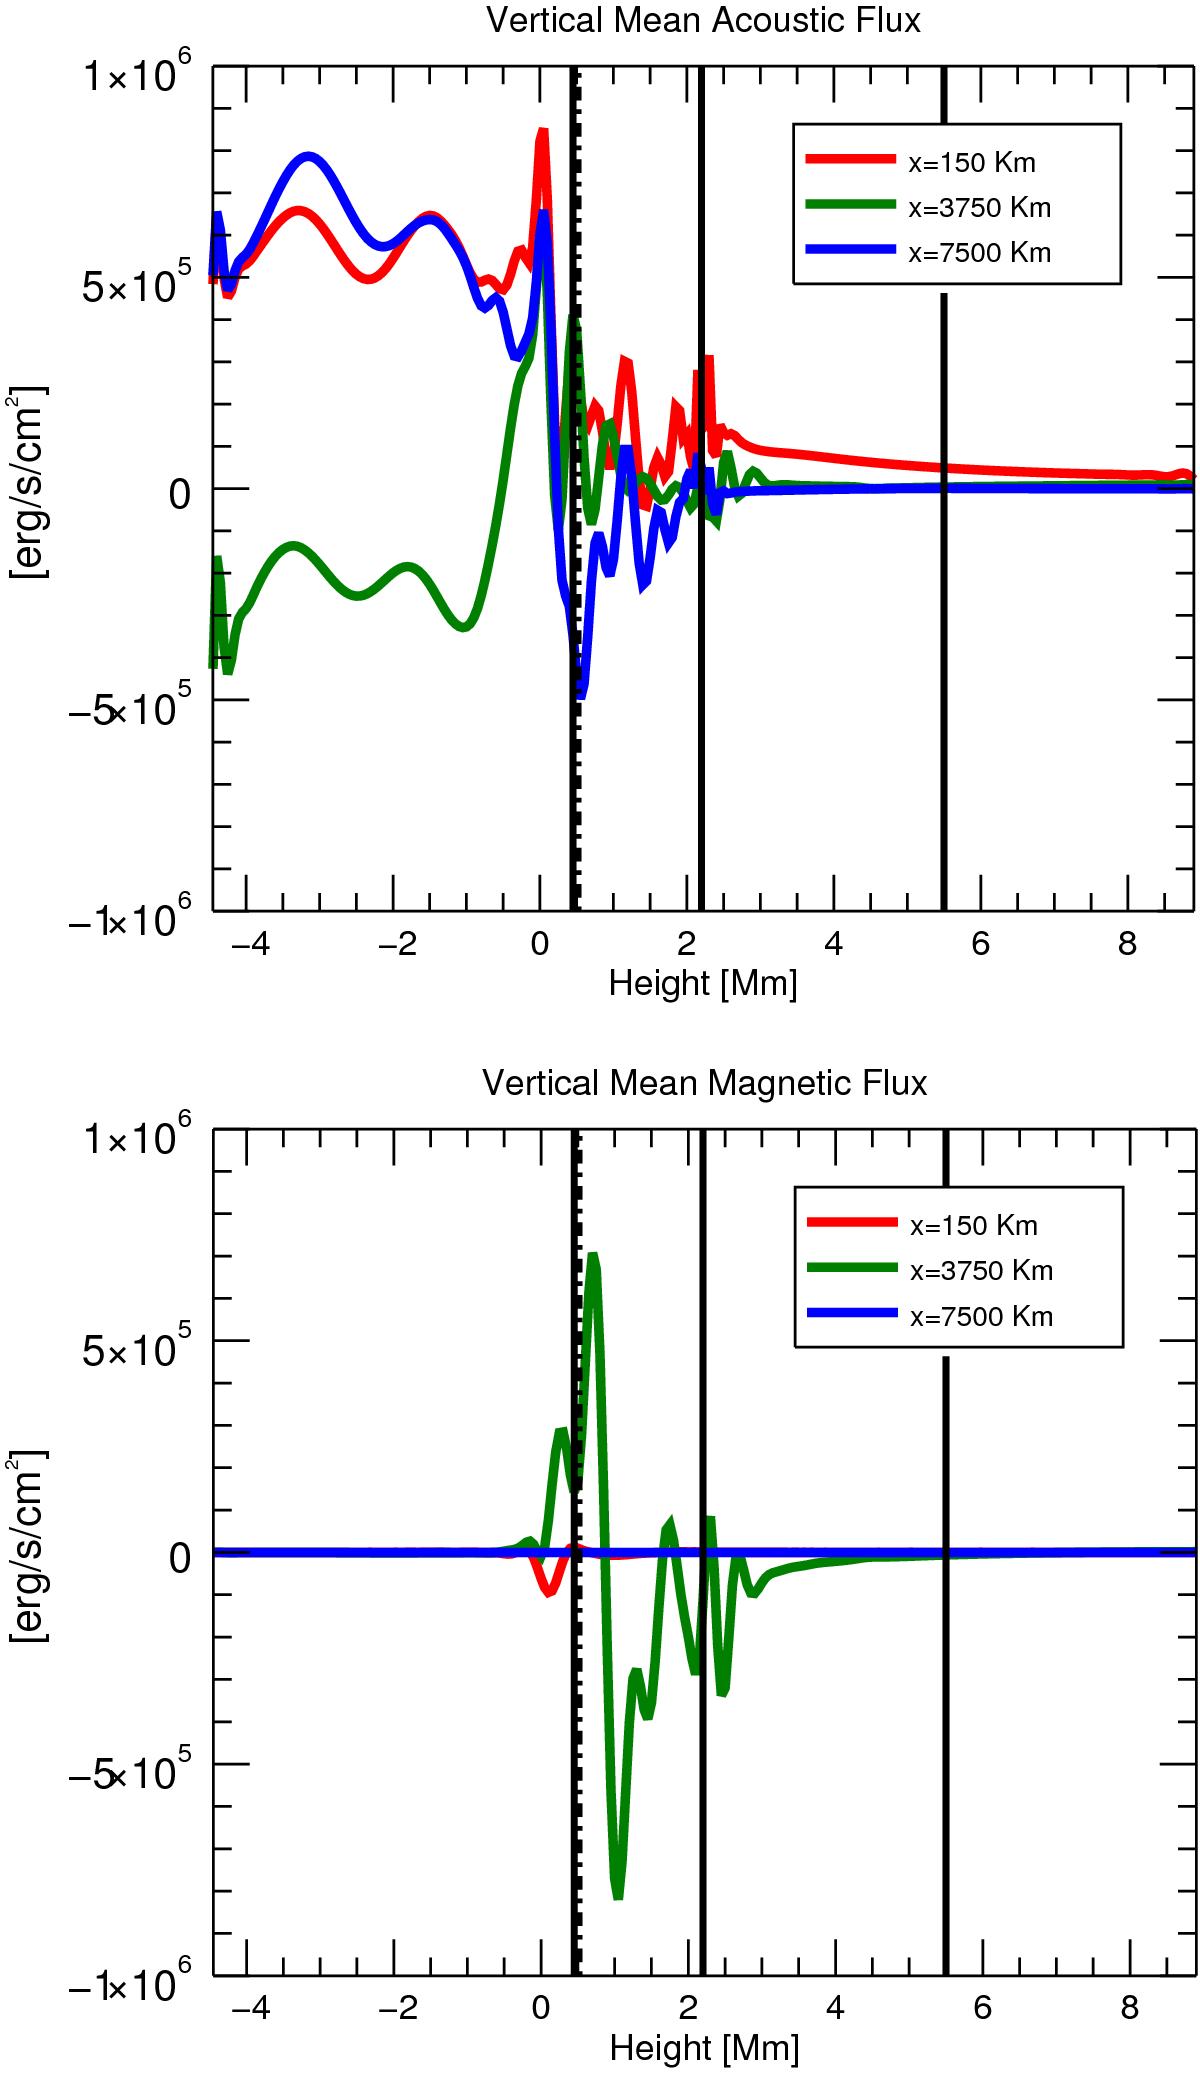
Vertical cut of the vertical component of the acoustic (top) and magnetic (bottom) mean fluxes for three different horizontal positions, as indicated in each panel. The vertical black lines are the locations of the cut-off frequency for 200-s period waves, β = 1 contours (dashed), transition region, and the null point (from left to right).
Current usage metrics show cumulative count of Article Views (full-text article views including HTML views, PDF and ePub downloads, according to the available data) and Abstracts Views on Vision4Press platform.
Data correspond to usage on the plateform after 2015. The current usage metrics is available 48-96 hours after online publication and is updated daily on week days.
Initial download of the metrics may take a while.