Fig. 4
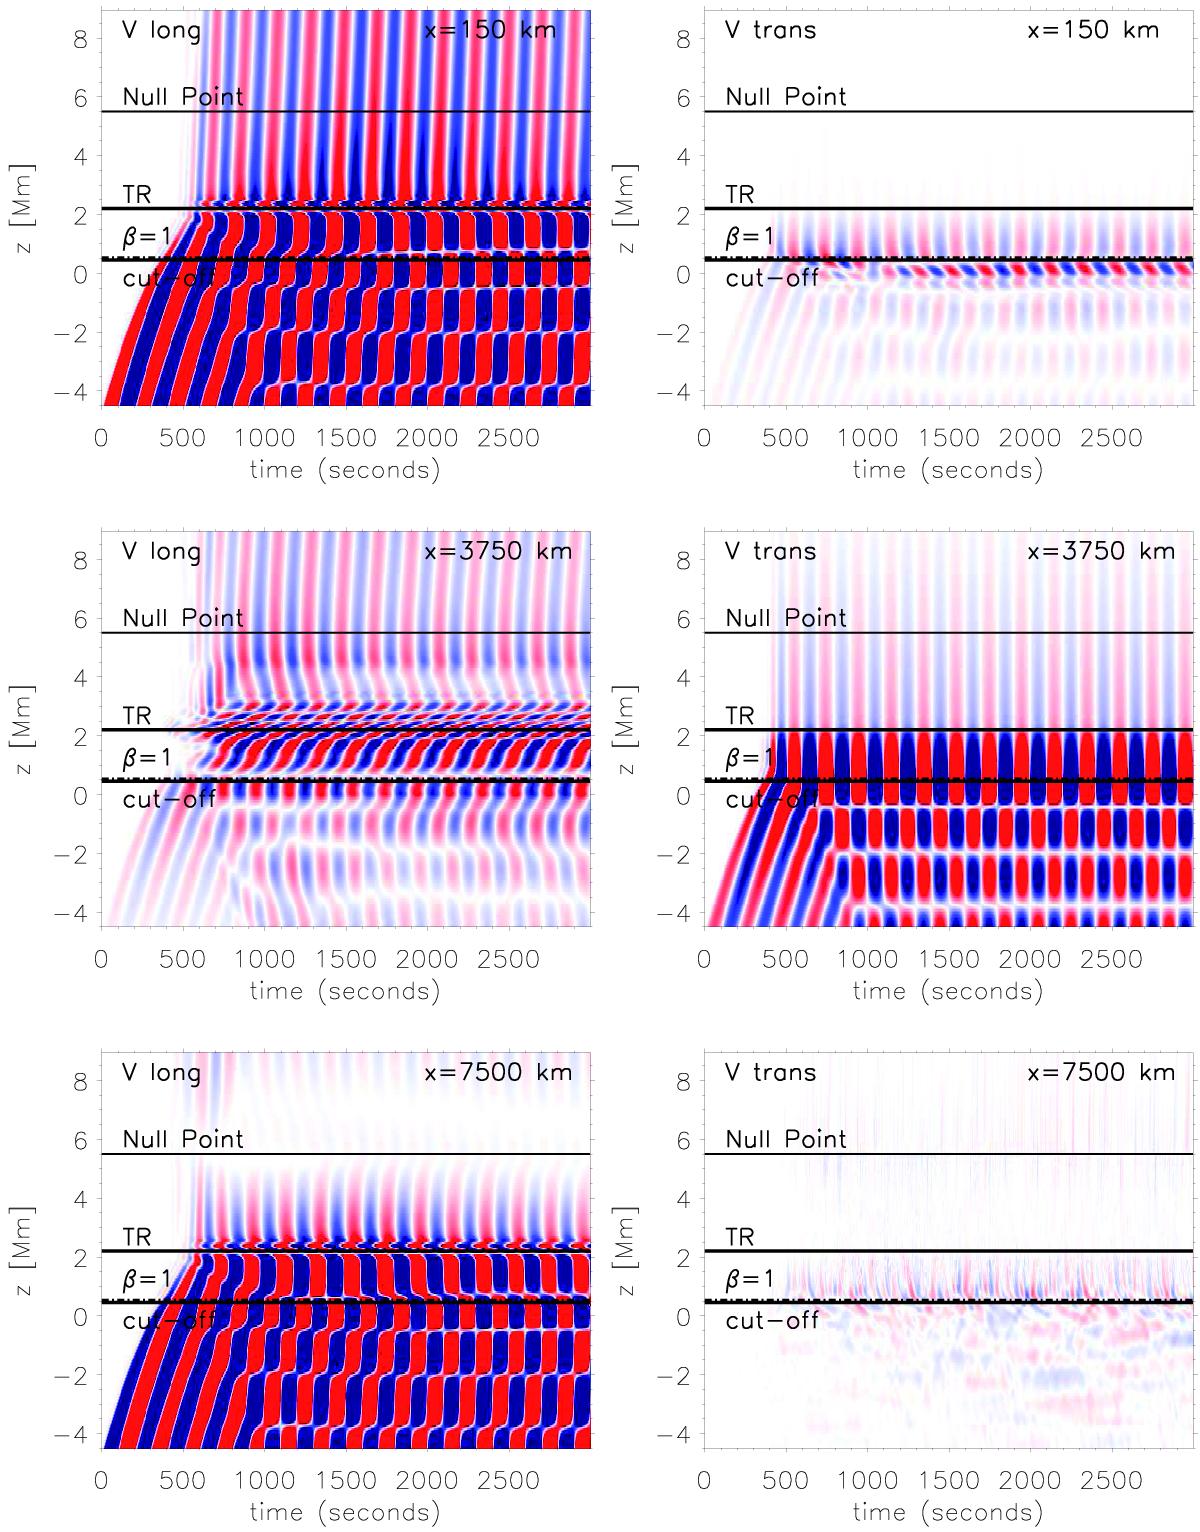
Time-height diagram of ![]() (left) and
(left) and ![]() (right) for three selected horizontal positions in the vertical periodic driver simulations. Upper row: x = 150 km, where the magnetic field is nearly vertical. Middle row: x = 3750 km, close to the center of the left arcade with a nearly horizontal magnetic field. Bottom row: x = 7500 km close to the null-point location. The color scale is the same as in Fig. 3.
(right) for three selected horizontal positions in the vertical periodic driver simulations. Upper row: x = 150 km, where the magnetic field is nearly vertical. Middle row: x = 3750 km, close to the center of the left arcade with a nearly horizontal magnetic field. Bottom row: x = 7500 km close to the null-point location. The color scale is the same as in Fig. 3.
Current usage metrics show cumulative count of Article Views (full-text article views including HTML views, PDF and ePub downloads, according to the available data) and Abstracts Views on Vision4Press platform.
Data correspond to usage on the plateform after 2015. The current usage metrics is available 48-96 hours after online publication and is updated daily on week days.
Initial download of the metrics may take a while.