Fig. 3
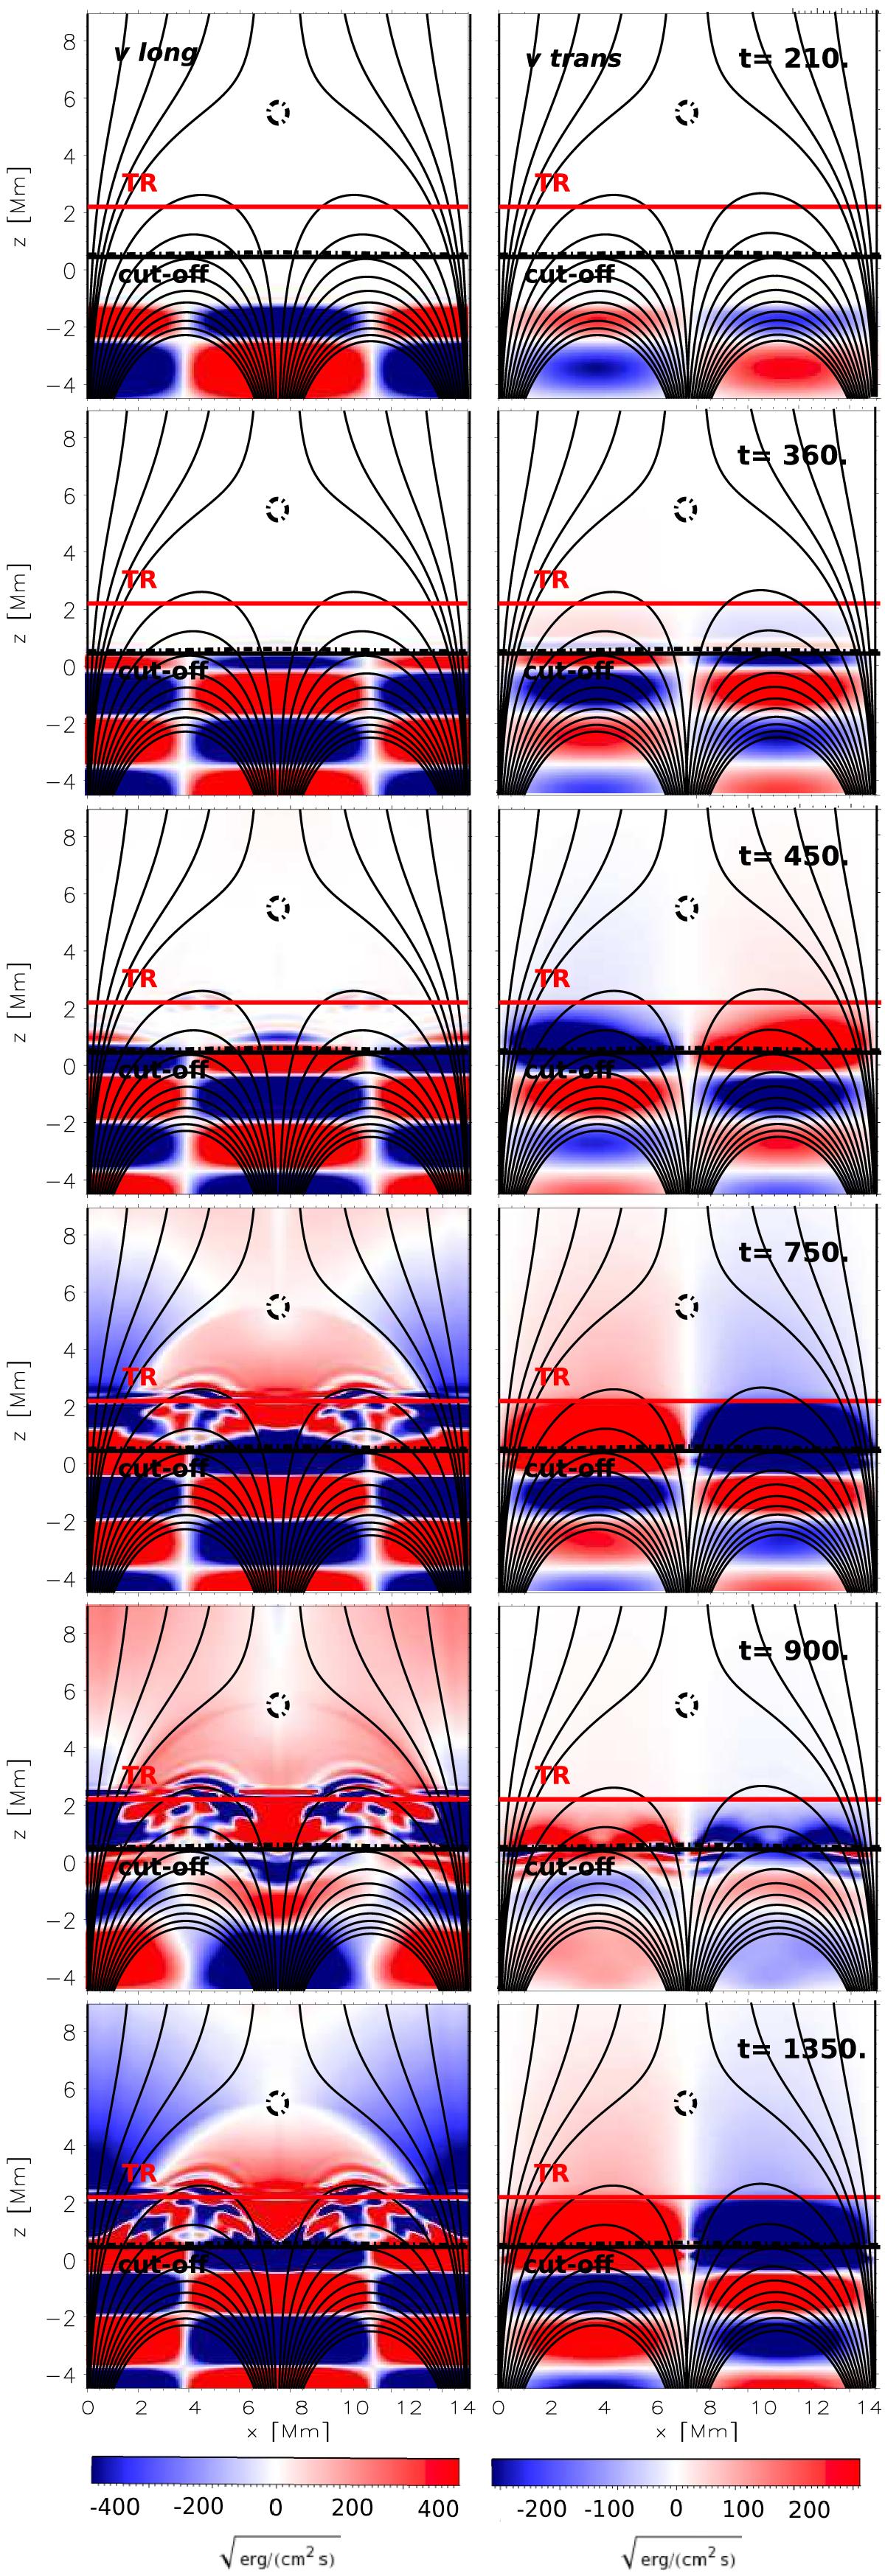
Longitudinal (left) and transverse (right) velocities multiplied by ![]() and
and ![]() , respectively, for the simulation run with a vertical periodic driver. The black solid line is the location of the cut-off frequency for the 200 s period waves, the dashed black lines are the β = 1 contours, and the red line shows the transition region. The magnetic field lines are inclined black lines. Positive velocity (red color) is an upflow. The movie of the wave propagation is available online.
, respectively, for the simulation run with a vertical periodic driver. The black solid line is the location of the cut-off frequency for the 200 s period waves, the dashed black lines are the β = 1 contours, and the red line shows the transition region. The magnetic field lines are inclined black lines. Positive velocity (red color) is an upflow. The movie of the wave propagation is available online.
Current usage metrics show cumulative count of Article Views (full-text article views including HTML views, PDF and ePub downloads, according to the available data) and Abstracts Views on Vision4Press platform.
Data correspond to usage on the plateform after 2015. The current usage metrics is available 48-96 hours after online publication and is updated daily on week days.
Initial download of the metrics may take a while.