Free Access
Fig. 13
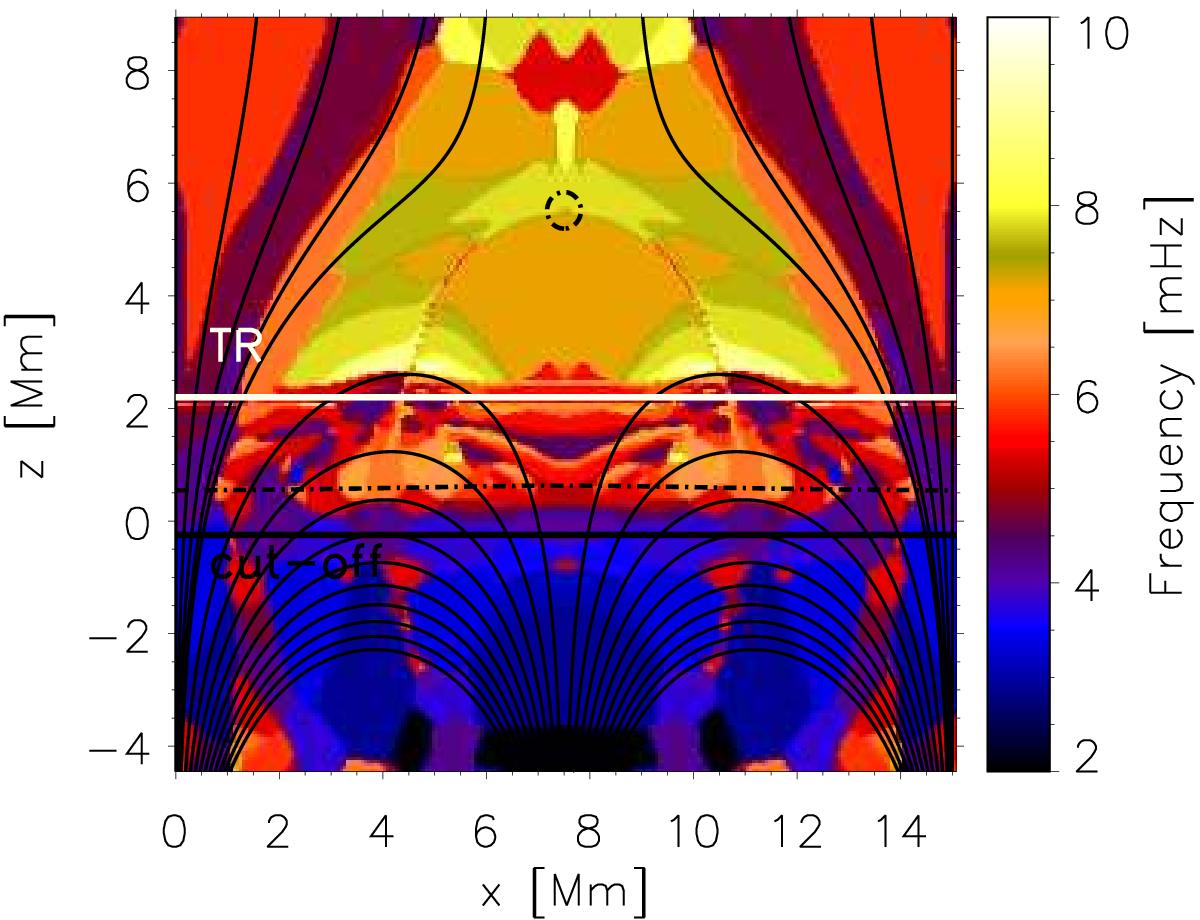
Spatial distribution of the dominant frequencies of the vertically propagating waves for simulations with pressure pulse. The dashed-dotted black line marks β = 1 contours, and white solid line marks the transition region.
Current usage metrics show cumulative count of Article Views (full-text article views including HTML views, PDF and ePub downloads, according to the available data) and Abstracts Views on Vision4Press platform.
Data correspond to usage on the plateform after 2015. The current usage metrics is available 48-96 hours after online publication and is updated daily on week days.
Initial download of the metrics may take a while.