Free Access
Fig. 1
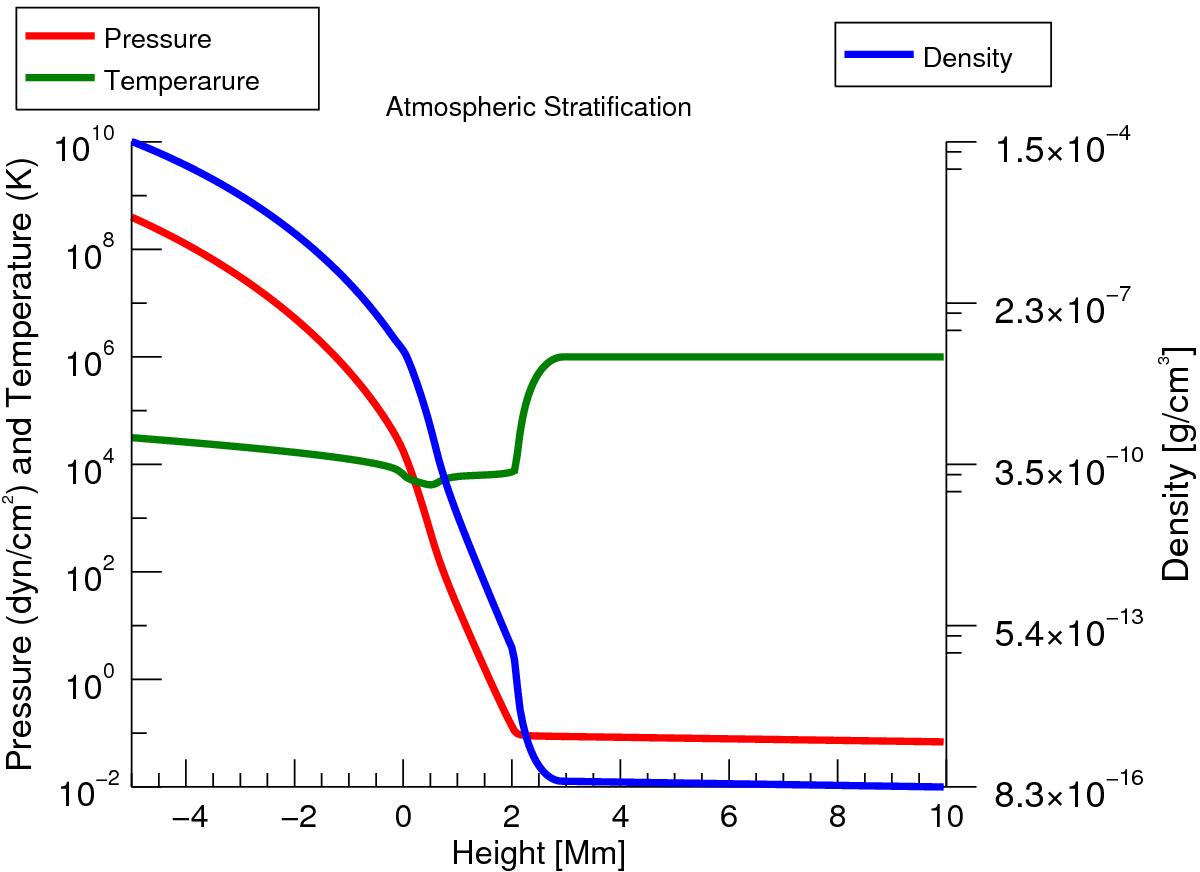
Temperature (green line), density (blue line), and pressure (red line) distributions. The left vertical axis gives us the values for temperature and pressure, and the vertical axis on the right is the density scale.
Current usage metrics show cumulative count of Article Views (full-text article views including HTML views, PDF and ePub downloads, according to the available data) and Abstracts Views on Vision4Press platform.
Data correspond to usage on the plateform after 2015. The current usage metrics is available 48-96 hours after online publication and is updated daily on week days.
Initial download of the metrics may take a while.