Fig. 9
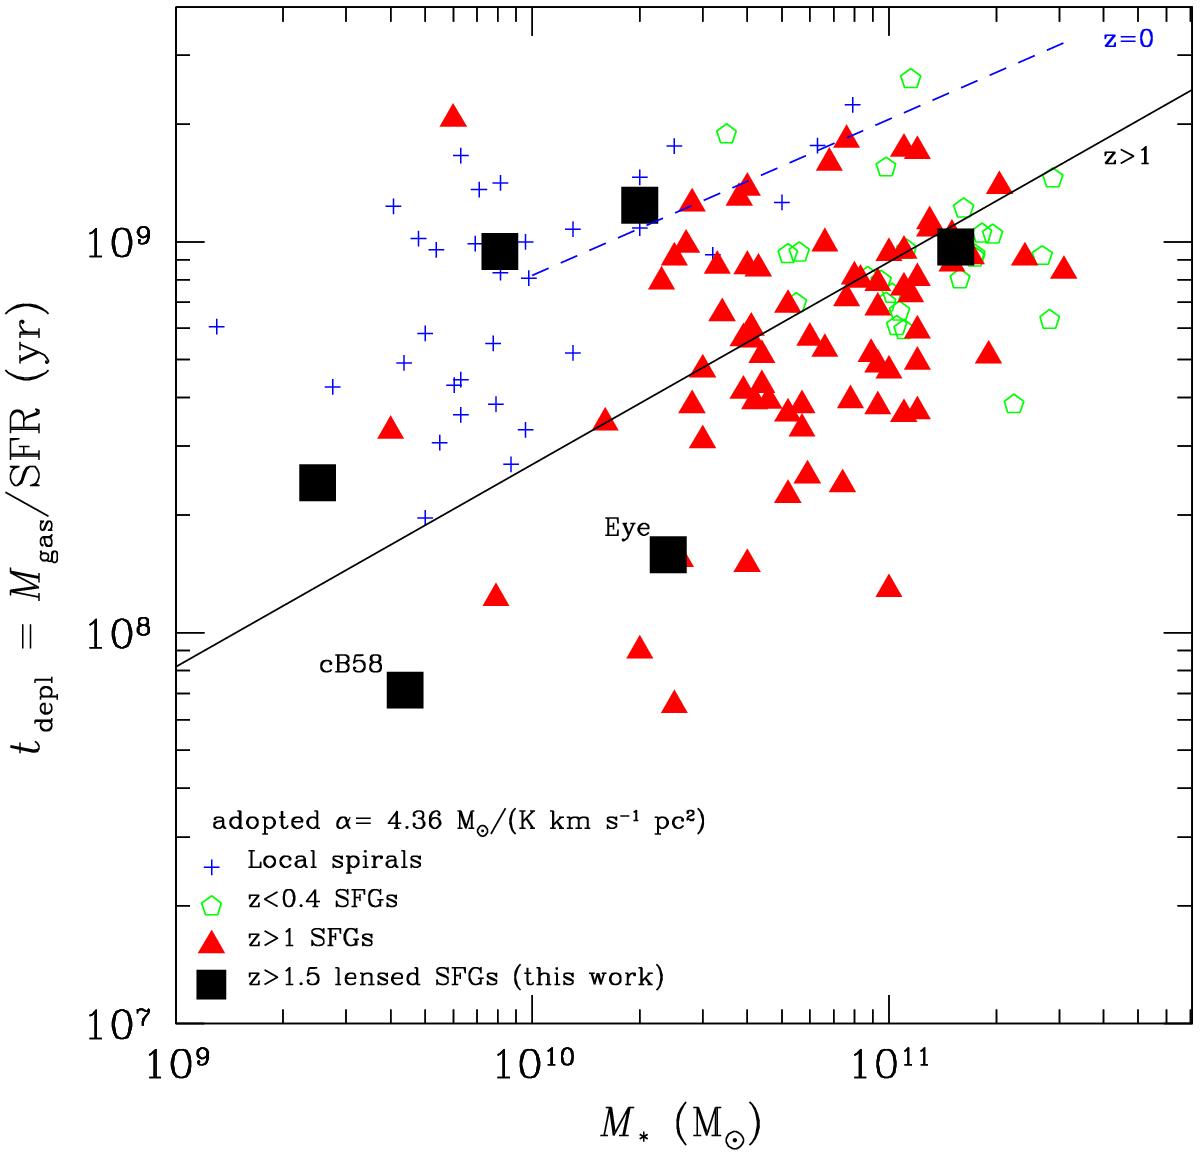
Molecular gas depletion timescales, tdepl = Mgas/SFR, as a function of stellar masses plotted for our low-LIR-selected SFGs (squares) and our comparison sample of SFGs and local spirals with CO measurements from the literature (see Sect. 2.2). The molecular gas depletion timescales are computed assuming a “Galactic” CO–H2 conversion factor for all galaxies. A tdepl–M∗ correlation emerges for z> 1 SFGs; their best-fitting bisector linear relation, log (tdepl) = (0.52 ± 0.16)log (M∗) + (3.25 ± 1.74), is plotted as a solid black line. The best-fitting bisector linear relation to the z = 0 COLD GASS sample from Saintonge et al. (2011) is shown with the dashed blue line.
Current usage metrics show cumulative count of Article Views (full-text article views including HTML views, PDF and ePub downloads, according to the available data) and Abstracts Views on Vision4Press platform.
Data correspond to usage on the plateform after 2015. The current usage metrics is available 48-96 hours after online publication and is updated daily on week days.
Initial download of the metrics may take a while.