Fig. 6
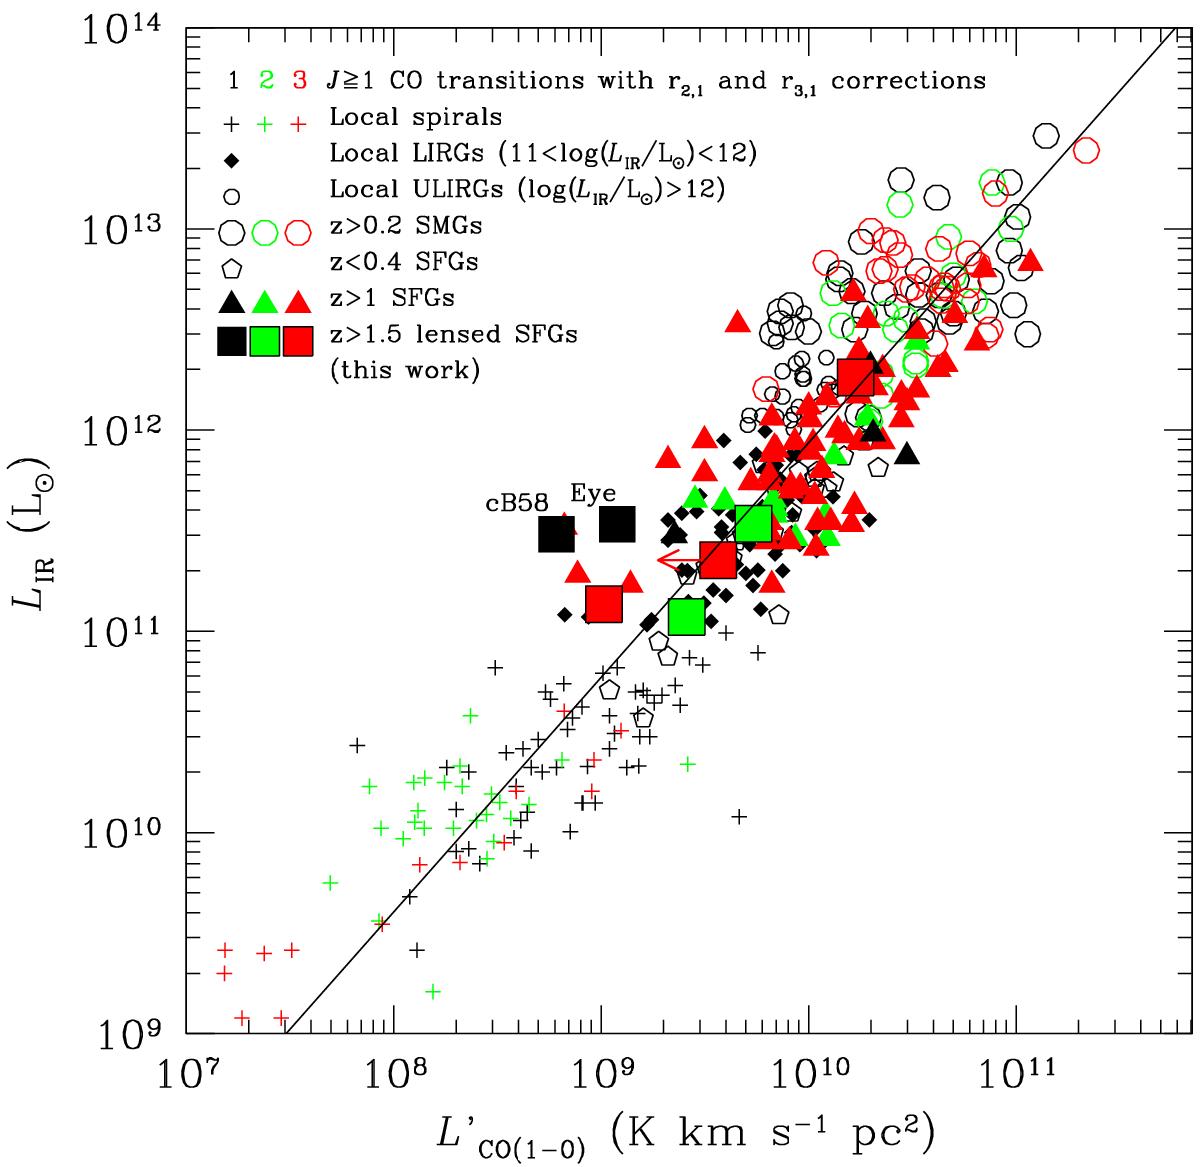
IR luminosities as a function of CO(1−0) luminosities of our low-LIR-selected SFGs (squares) compared to our compilation of galaxies with CO measurements from the literature (see Sect. 2.2). The color-coding of the various symbols refers to the J = 1, 2, and 3 CO transitions used to infer ![]() by applying the CO luminosity correction factors determined in Sect. 4. The best-fitting bisector linear relation to the entire sample of galaxies,
by applying the CO luminosity correction factors determined in Sect. 4. The best-fitting bisector linear relation to the entire sample of galaxies, ![]() , is plotted as a solid line. The z> 1 SFGs have on average a scatter in LIR as large as 1 dex at a given value of
, is plotted as a solid line. The z> 1 SFGs have on average a scatter in LIR as large as 1 dex at a given value of ![]() and a 1σ dispersion of 0.38 dex in the y-direction about the best-fitting LIR–
and a 1σ dispersion of 0.38 dex in the y-direction about the best-fitting LIR–![]() relation.
relation.
Current usage metrics show cumulative count of Article Views (full-text article views including HTML views, PDF and ePub downloads, according to the available data) and Abstracts Views on Vision4Press platform.
Data correspond to usage on the plateform after 2015. The current usage metrics is available 48-96 hours after online publication and is updated daily on week days.
Initial download of the metrics may take a while.