Fig. 5
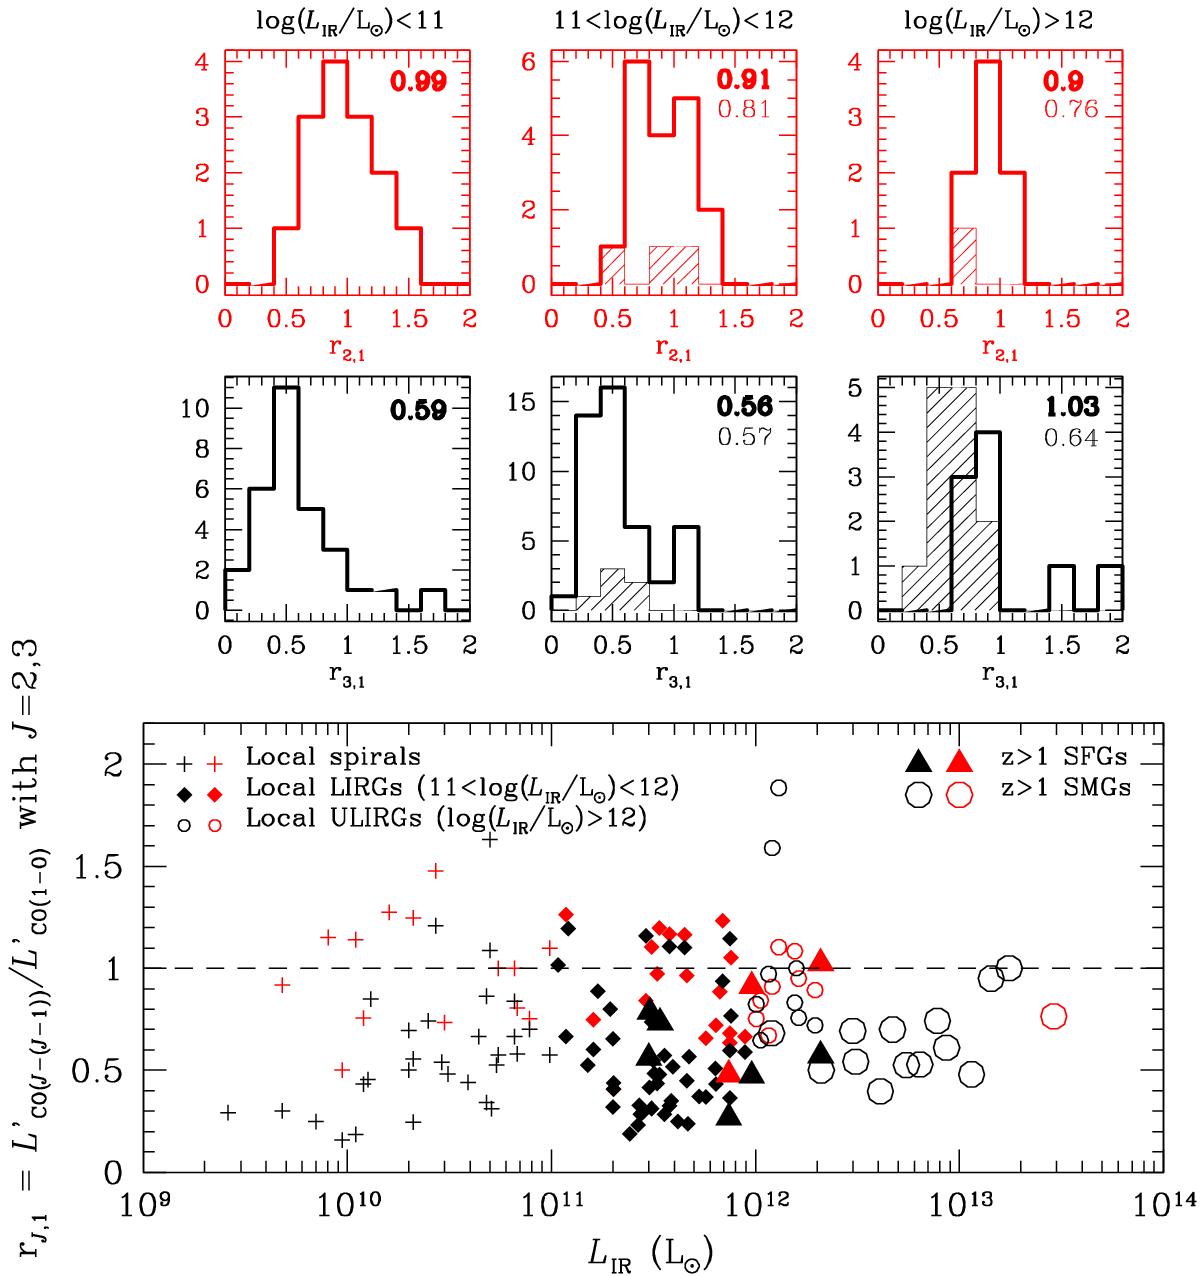
Bottom panel: luminosity correction factors, ![]() (in red) and
(in red) and ![]() (in black), plotted as a function of the IR luminosity for galaxies from our comparison sample (see Sect. 2.2). Upper, middle panels: r2,1 and r3,1 distributions of z = 0 galaxies (open histograms) and z> 1 galaxies (hatched histograms), respectively, plotted for three LIR intervals: LIR< 1011L⊙ (the “spiral” regime), 1011L⊙<LIR< 1012L⊙ (the “LIRG” regime), and LIR> 1012L⊙ (the “ULIRG” regime) from left to right. The numbers in the upper right corner of each panel are the mean values of the rJ,1 distributions (“thick” numbers refer to z = 0 galaxies and “thin” numbers to z> 1 galaxies).
(in black), plotted as a function of the IR luminosity for galaxies from our comparison sample (see Sect. 2.2). Upper, middle panels: r2,1 and r3,1 distributions of z = 0 galaxies (open histograms) and z> 1 galaxies (hatched histograms), respectively, plotted for three LIR intervals: LIR< 1011L⊙ (the “spiral” regime), 1011L⊙<LIR< 1012L⊙ (the “LIRG” regime), and LIR> 1012L⊙ (the “ULIRG” regime) from left to right. The numbers in the upper right corner of each panel are the mean values of the rJ,1 distributions (“thick” numbers refer to z = 0 galaxies and “thin” numbers to z> 1 galaxies).
Current usage metrics show cumulative count of Article Views (full-text article views including HTML views, PDF and ePub downloads, according to the available data) and Abstracts Views on Vision4Press platform.
Data correspond to usage on the plateform after 2015. The current usage metrics is available 48-96 hours after online publication and is updated daily on week days.
Initial download of the metrics may take a while.