Fig. 4
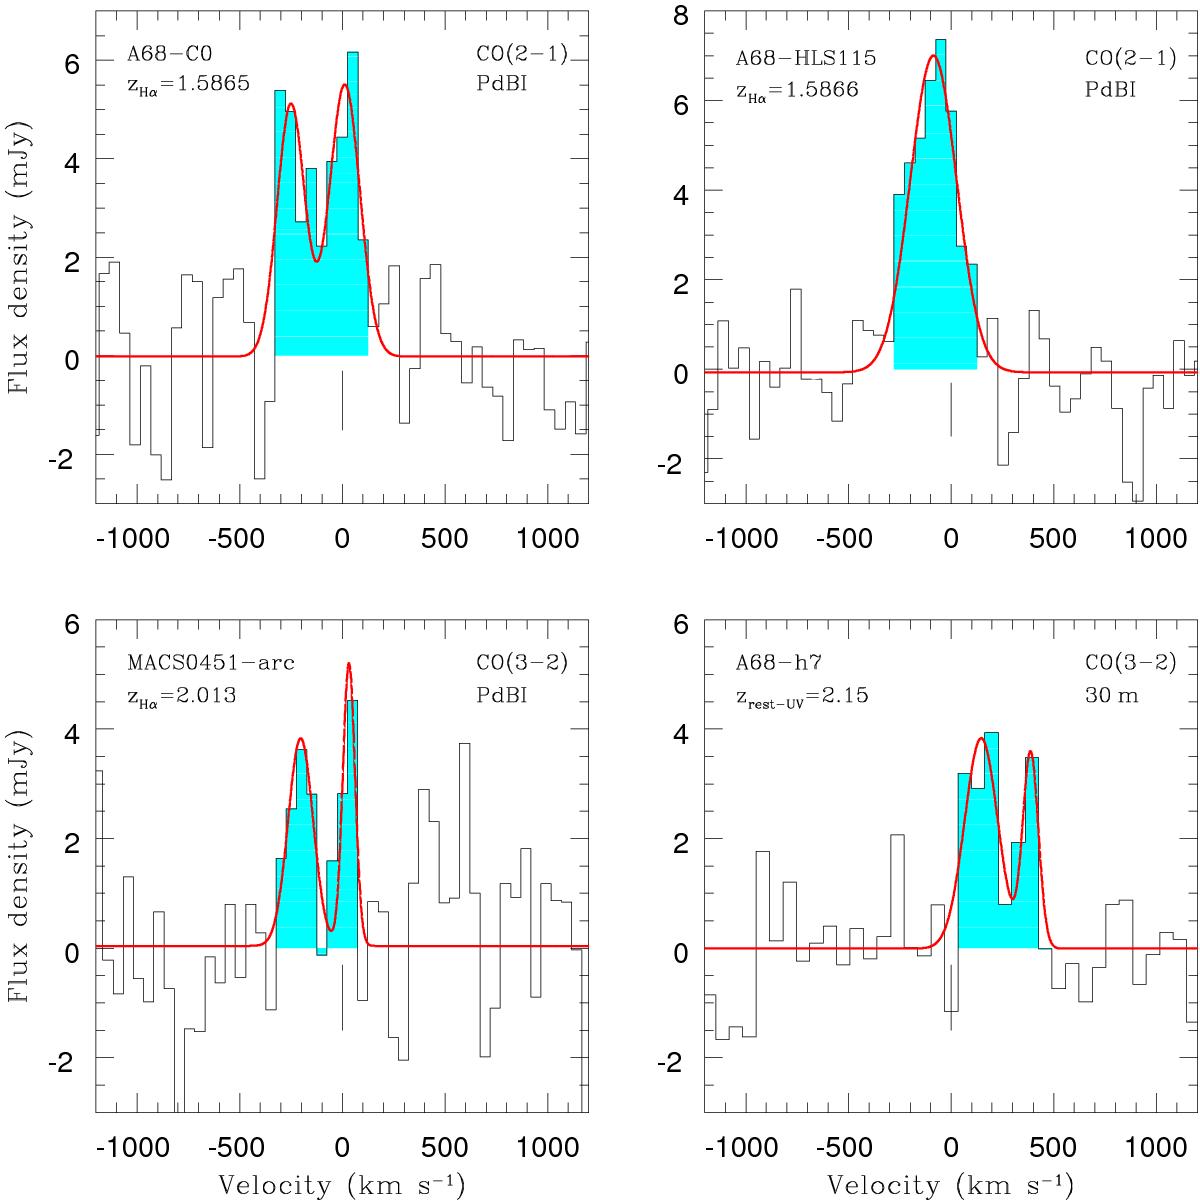
Spectra of the CO(2−1) or CO(3−2) emission line detected in our low-LIR-selected galaxies, binned in steps of 50 km s-1 except for A68-h7 where bins have a resolution of 65 km s-1. The cyan-shaded regions indicate channels where positive emission is detected. These channels have been used to derive total CO integrated fluxes and velocity-integrated maps shown in Fig. 3. The solid red lines are the best-fitting single or double Gaussian profiles to the observed CO line profiles. The zero velocity marked by the vertical bar corresponds to the tuning frequency of our targets listed in Table 2 and derived from the Hα line or rest-frame UV absorption lines redshifts.
Current usage metrics show cumulative count of Article Views (full-text article views including HTML views, PDF and ePub downloads, according to the available data) and Abstracts Views on Vision4Press platform.
Data correspond to usage on the plateform after 2015. The current usage metrics is available 48-96 hours after online publication and is updated daily on week days.
Initial download of the metrics may take a while.