Fig. 3
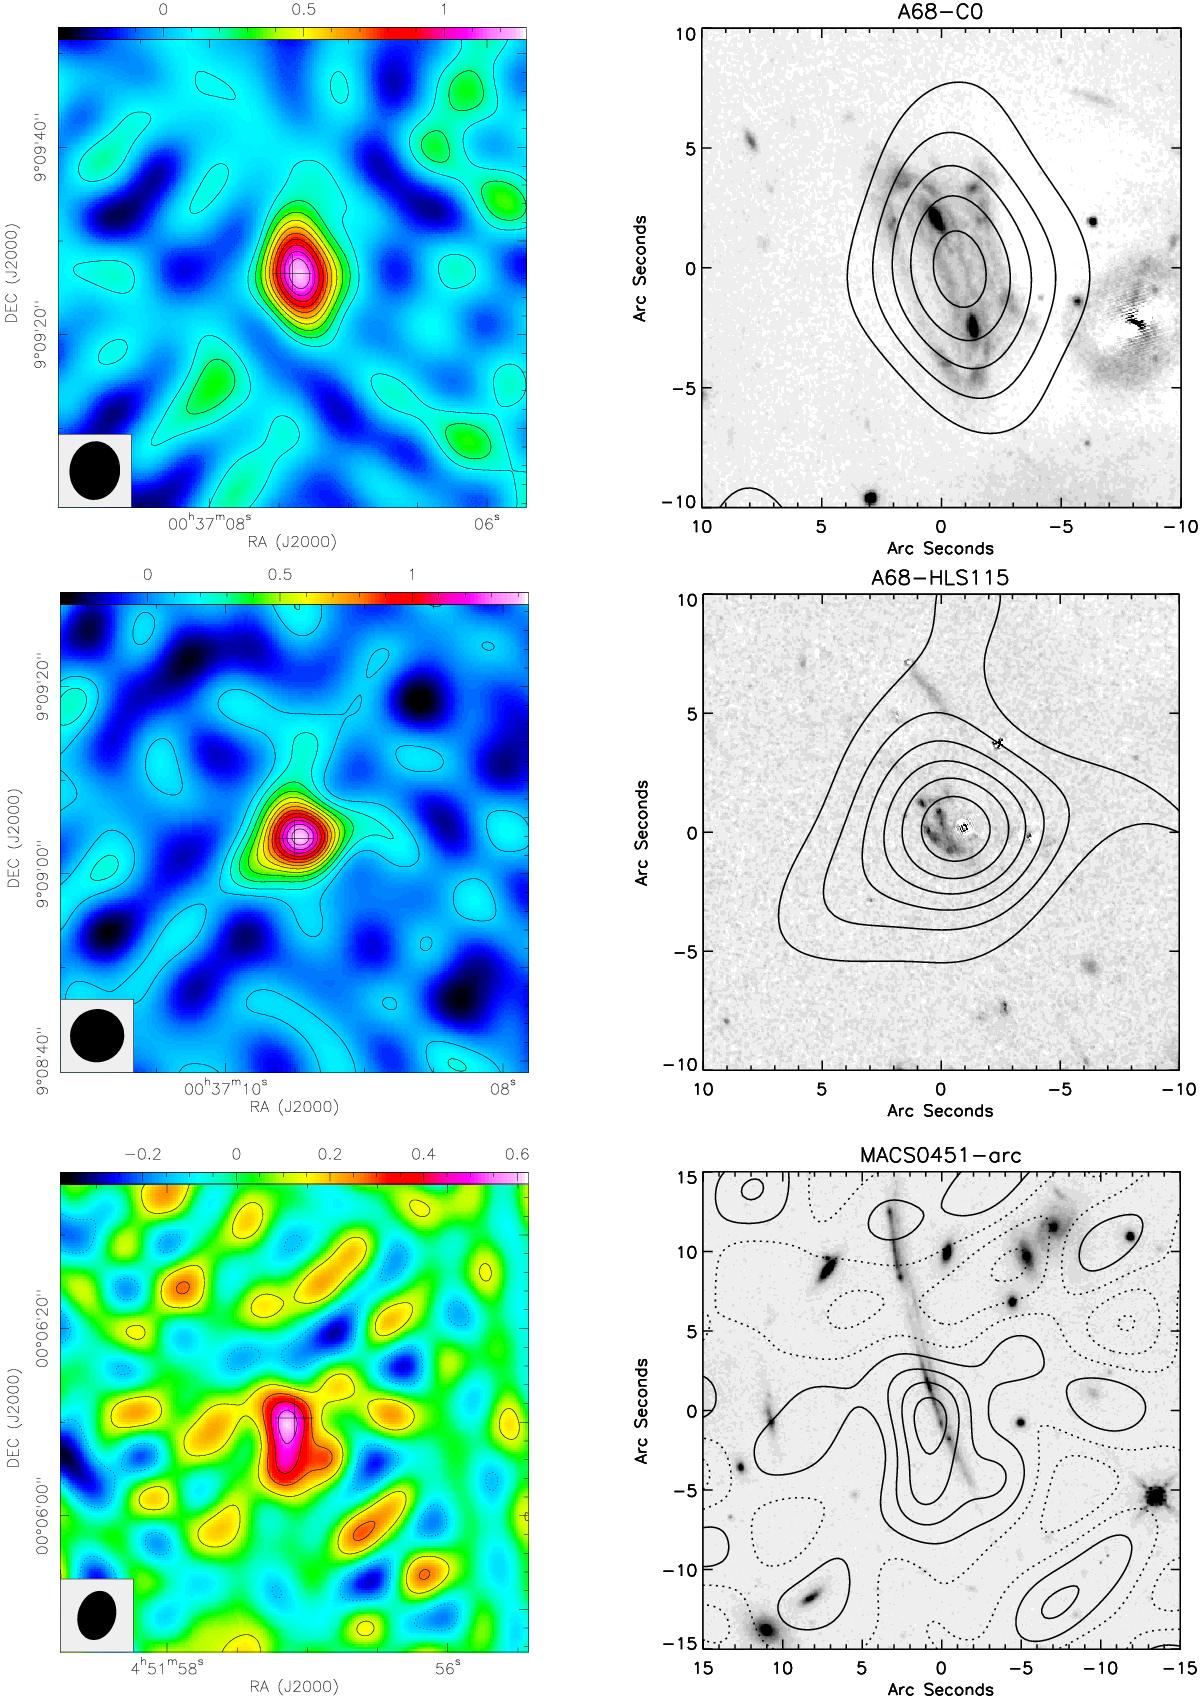
From top to bottom, we plot A68-C0, A68-HLS115, and MACS0451-arc. Left panels: velocity-integrated, cleaned maps of the CO(2−1) or CO(3−2) emission detected in three of our low-LIR-selected galaxies observed with the PdBI. The maps are integrated over the cyan-shaded channels shown in Fig. 4. Contour levels start at ± 1σ and are in steps of 1σ. The size and orientation of the beam is indicated by the black ellipse in the bottom left corner. None of these three CO detections is spatially resolved. The cross in each panel corresponds to the coordinates of the optical HST continuum position as listed in Table 2 and is ± 2″ (± 17 kpc at z ≃ 2) in size. The coding of the color bar is in units of integrated flux Jy km s-1. Right panels: CO(2−1) or CO(3−2) contours overlaid on the HST images in the F110W band for A68-C0, the F702W band for A68-HLS115, and the F140W band for MACS0451-arc. Contour levels start at ± 2σ and are in steps of 2σ, except for MACS0451-arc where they start at ± 1σ and are in steps of 1σ.
Current usage metrics show cumulative count of Article Views (full-text article views including HTML views, PDF and ePub downloads, according to the available data) and Abstracts Views on Vision4Press platform.
Data correspond to usage on the plateform after 2015. The current usage metrics is available 48-96 hours after online publication and is updated daily on week days.
Initial download of the metrics may take a while.