Fig. A.1
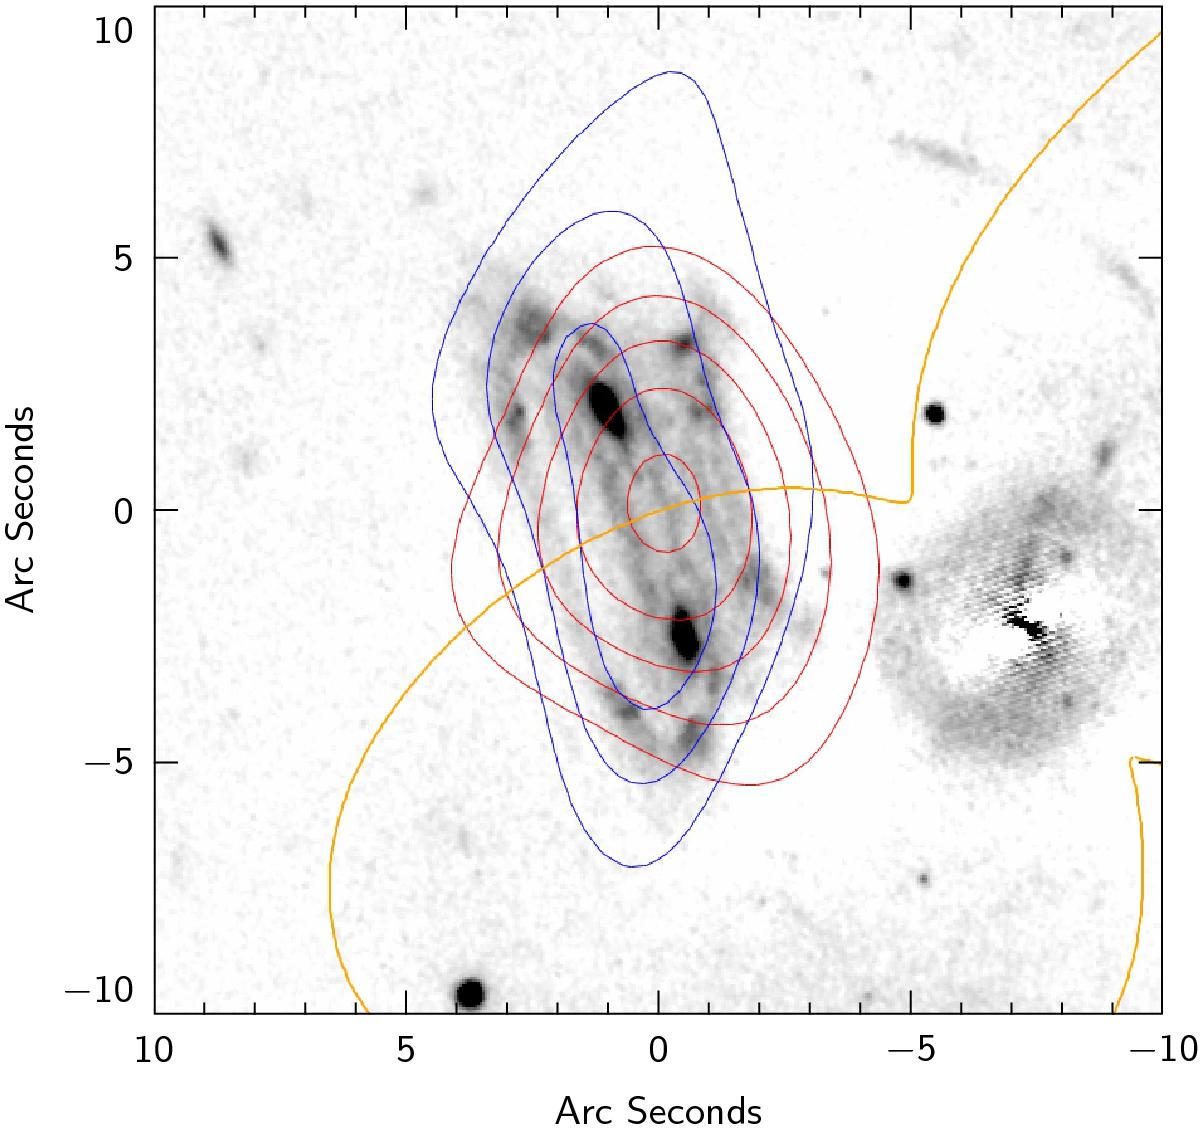
Velocity-integrated map of the CO(2−1) emission in A68-C0 overlaid on the HST image in band F110W. The extended blue contours are the contours integrated over the channels that define the blue-shifted component of the double-peaked CO emission line profile shown in Fig. 4, and the compact red contours are the contours integrated over the channels that define the red-shifted component of the CO profile. Contour levels start at ± 2σ and are in steps of 2σ. The critical line (yellow line) is located right in the middle of the two multiple images easily identified by the two bright bulges resolved in the HST image.
Current usage metrics show cumulative count of Article Views (full-text article views including HTML views, PDF and ePub downloads, according to the available data) and Abstracts Views on Vision4Press platform.
Data correspond to usage on the plateform after 2015. The current usage metrics is available 48-96 hours after online publication and is updated daily on week days.
Initial download of the metrics may take a while.