Fig. 14
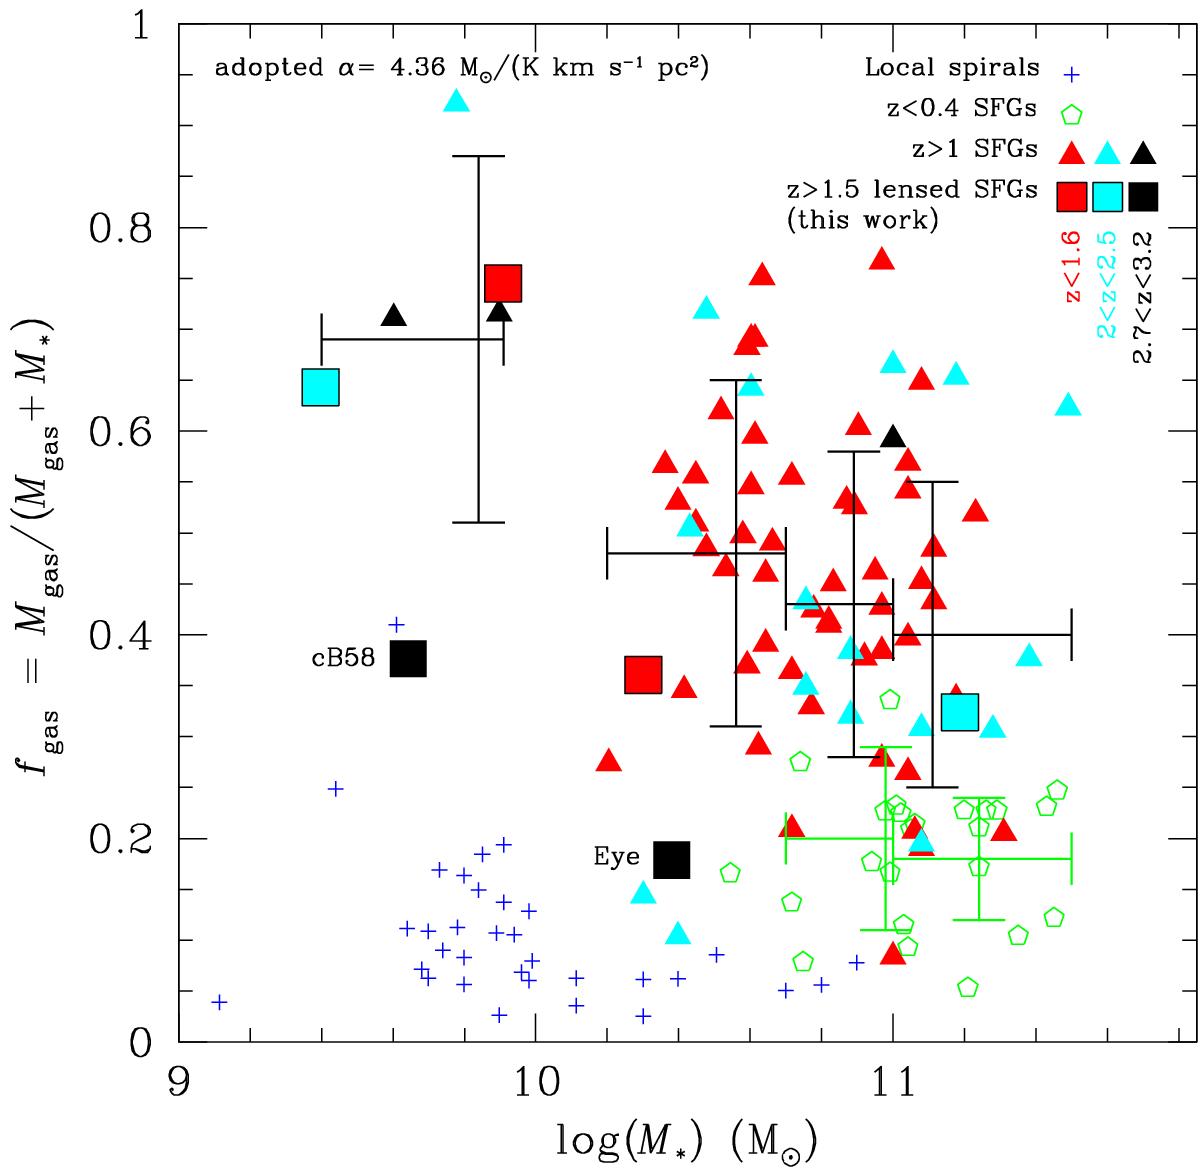
Molecular gas fractions, fgas = Mgas/ (Mgas + M∗), as a function of stellar masses plotted for our low-LIR-selected SFGs (squares) and our comparison sample of SFGs and local spirals with CO measurements from the literature (see Sect. 2.2). The molecular gas fractions are computed assuming a “Galactic” CO–H2 conversion factor for all galaxies. Four stellar mass bins are considered 9.4 < log (M∗/M⊙) < 9.9, 10.2 < log (M∗/M⊙) < 10.7, 10.7 < log (M∗/M⊙) < 11.0, and 11.0 < log (M∗/M⊙) < 11.5. The corresponding fgas means with their 1σ dispersion of z> 1 SFGs are shown with the large black crosses, and of z< 0.4 SFGs with the large green crosses. The M∗ dependence of fgas sustains an upturn of the molecular gas fraction at the low-M∗ end, a mild decrease toward higher M∗ for SFGs at z> 1, and a shift toward lower fgas values for SFGs at lower redshifts. The color-coding of SFGs (our sample plus z> 1 SFGs from the literature) refers to three redshift intervals: ⟨ z1.2 ⟩ = [ 1,1.6 ] (red), ⟨ z2.2 ⟩ = [ 2,2.5 ] (cyan), and ⟨ z3.0 ⟩ = [ 2.7,3.2 ] (black).
Current usage metrics show cumulative count of Article Views (full-text article views including HTML views, PDF and ePub downloads, according to the available data) and Abstracts Views on Vision4Press platform.
Data correspond to usage on the plateform after 2015. The current usage metrics is available 48-96 hours after online publication and is updated daily on week days.
Initial download of the metrics may take a while.