Fig. 10
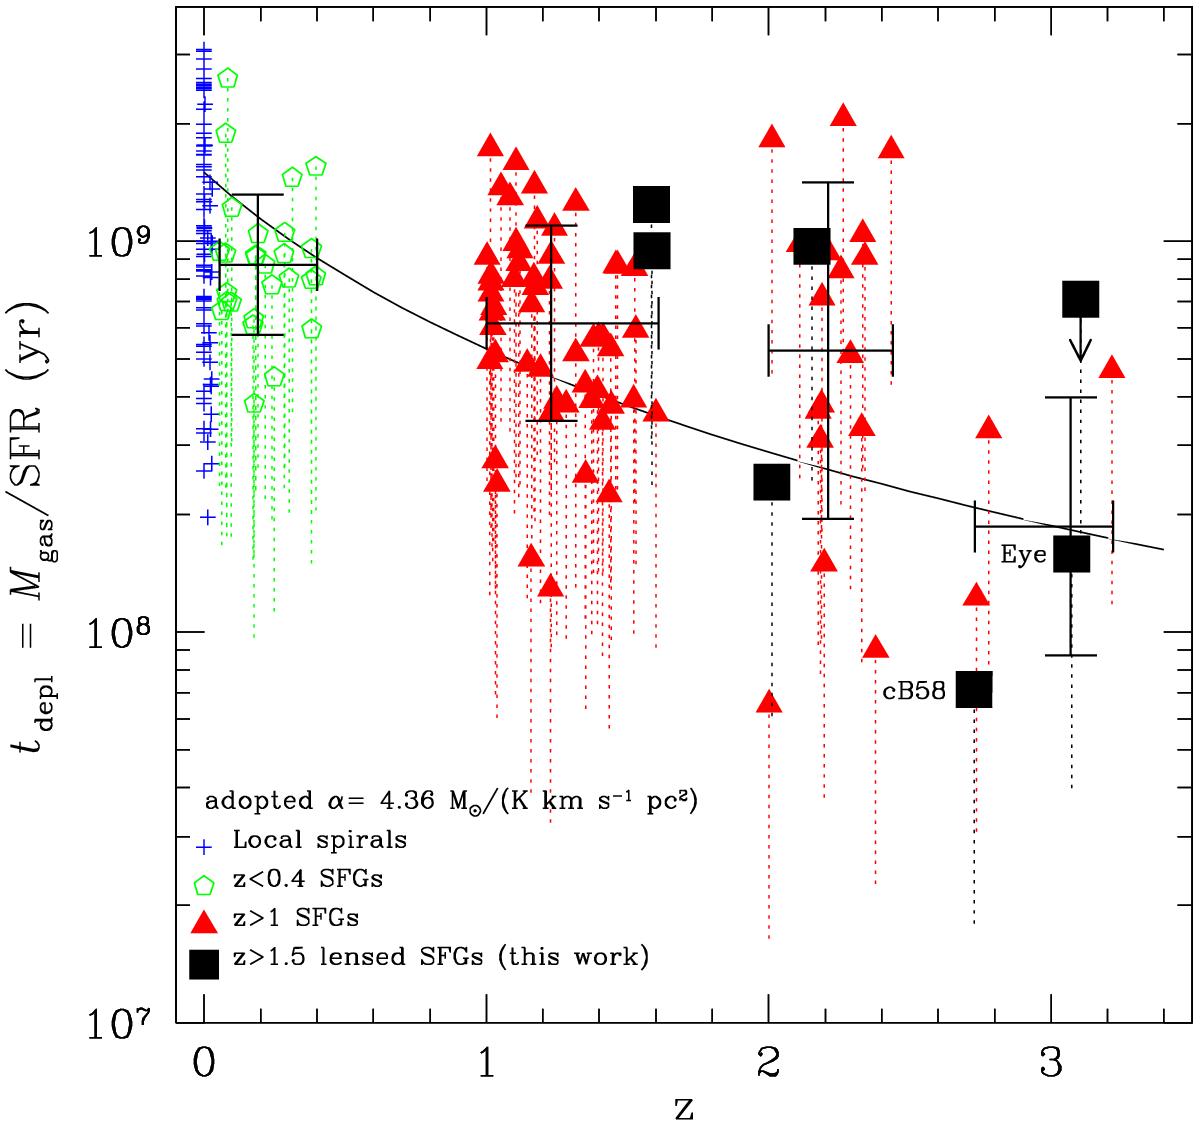
Molecular gas depletion timescales, tdepl = Mgas/SFR, as a function of redshift plotted for our low-LIR-selected SFGs (squares) and our comparison sample of SFGs and local spirals with CO measurements from the literature (see Sect. 2.2). The molecular gas depletion timescales are computed assuming a “Galactic” CO–H2 conversion factor for all galaxies, but for z< 0.4 and z> 1 SFGs (pentagons, triangles, and squares) the dotted lines, in addition, show the interval of possible tdepl values as determined with two extreme CO–H2 conversion factors α = 4.36 (“Galactic” value) and 1.1 (local ULIRG value). A redshift evolution of tdepl is observed in agreement with the expected 1.5 × (1 + z)-1.5 dependence of Davé et al. (2012), where the normalization is set to the typical depletion time of 1.5 Gyr observed in local galaxies (solid line). Four redshift bins are considered, ⟨ z0.2 ⟩ = [ 0.055,0.4 ], ⟨ z1.2 ⟩ = [ 1,1.6 ], ⟨ z2.2 ⟩ = [ 2,2.5 ], and ⟨ z3.0 ⟩ = [ 2.7,3.2 ], for the tdepl means shown with the large black crosses with their 1σ dispersion.
Current usage metrics show cumulative count of Article Views (full-text article views including HTML views, PDF and ePub downloads, according to the available data) and Abstracts Views on Vision4Press platform.
Data correspond to usage on the plateform after 2015. The current usage metrics is available 48-96 hours after online publication and is updated daily on week days.
Initial download of the metrics may take a while.