Fig. 1
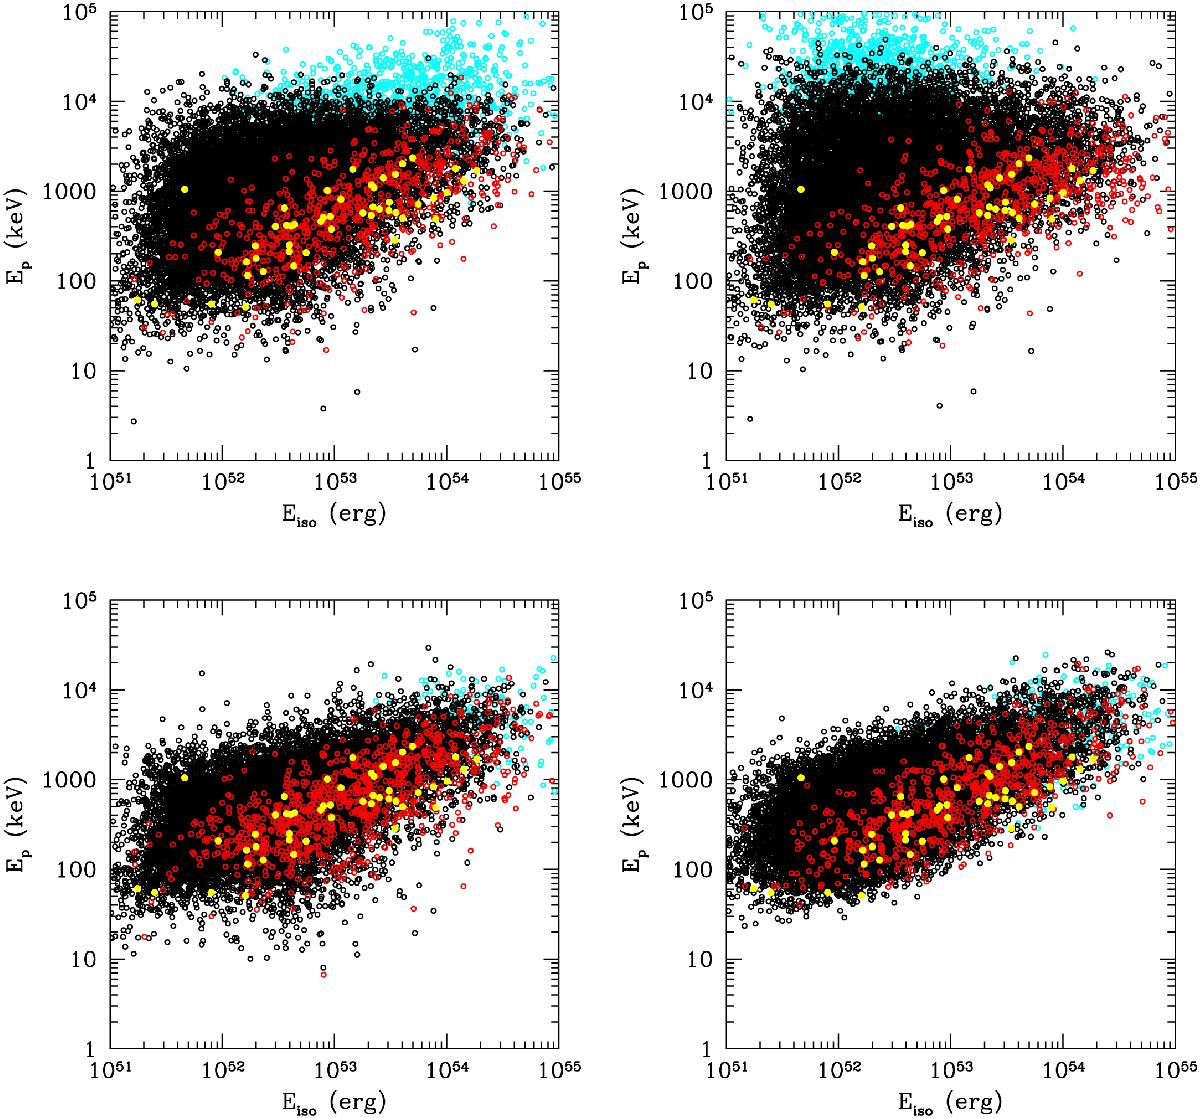
Ep − Eiso relations with differents assumptions for the model parameters; black dots: whole synthetic population, except (in cyan) bursts that are optically thick as a result of photon-photon annihilation; red dots: detected bursts assuming a threshold of 2.6 ph cm-2 s-1 between 15 and 150 keV; yellow dots: observed BAT6 sample (Salvaterra et al. 2012). Upper left panel: no correlation among model parameters. Upper right panel: ![]() . Bottom left panel:
. Bottom left panel: ![]() . Bottom right panel:
. Bottom right panel: ![]() .
.
Current usage metrics show cumulative count of Article Views (full-text article views including HTML views, PDF and ePub downloads, according to the available data) and Abstracts Views on Vision4Press platform.
Data correspond to usage on the plateform after 2015. The current usage metrics is available 48-96 hours after online publication and is updated daily on week days.
Initial download of the metrics may take a while.