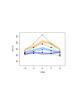
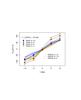
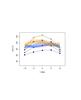
Fig. 4
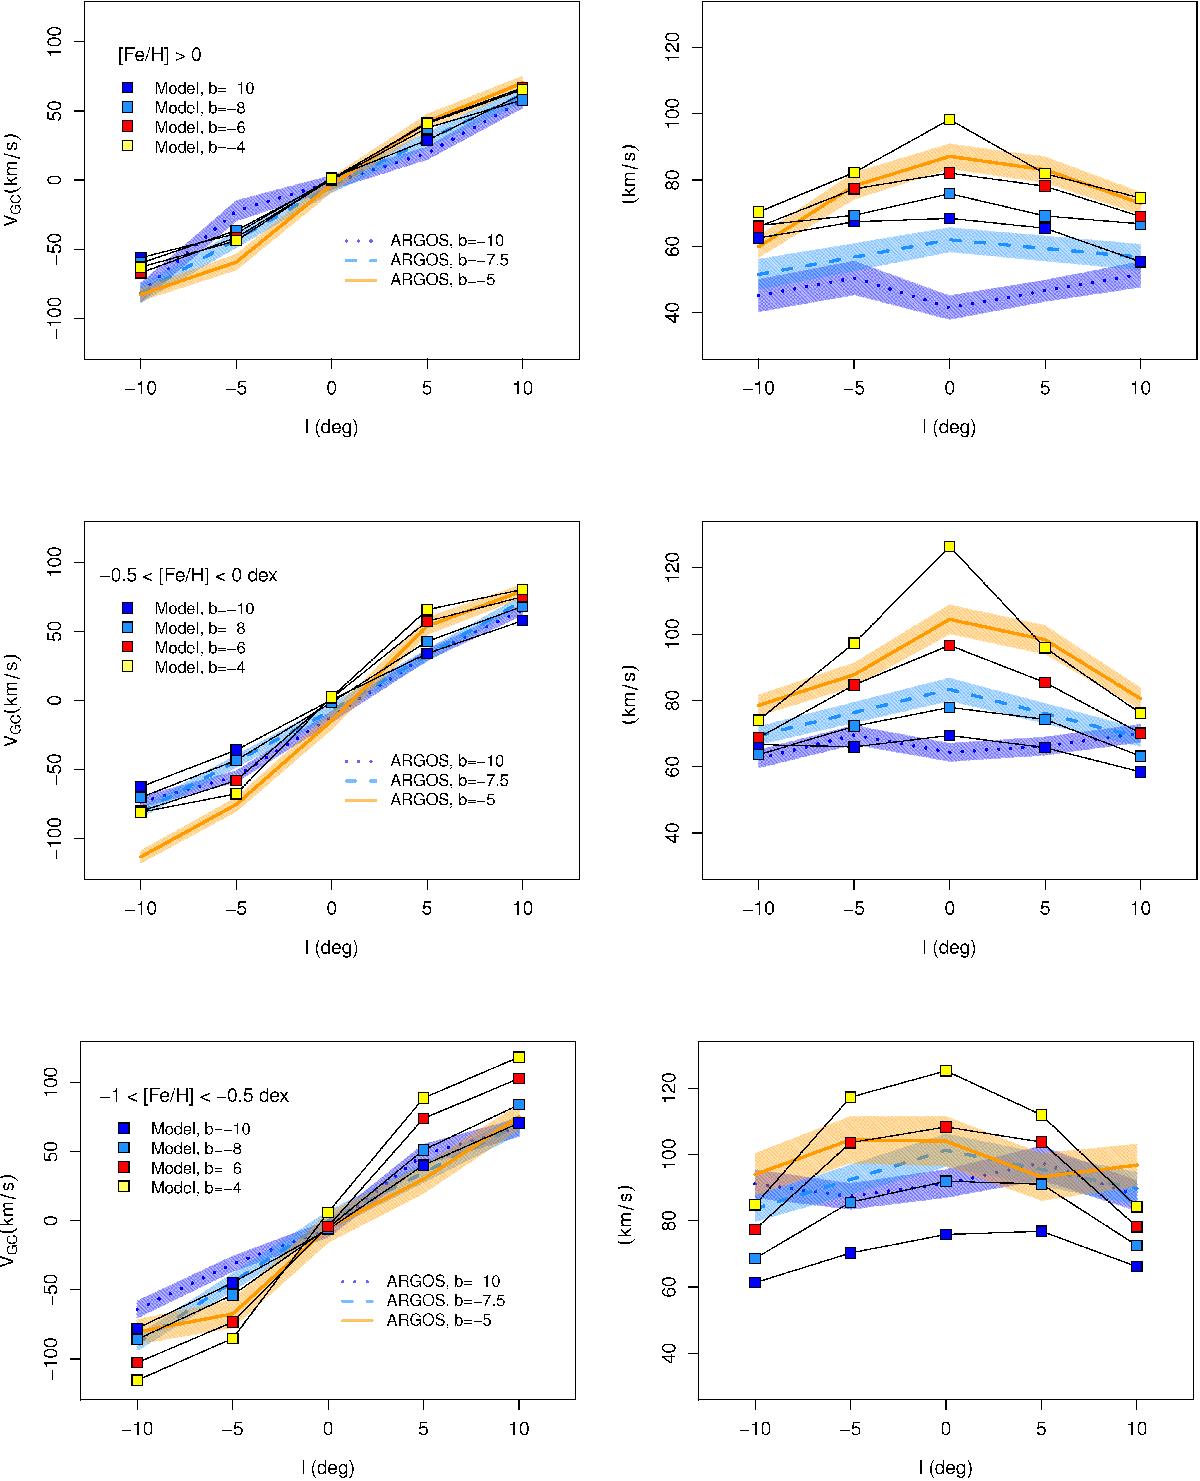
Rotation curve (left panels) and velocity dispersions (right panels) of a boxy bulge formed from a thin stellar disk (square symbols) compared to ARGOS data (colored curves). In the N-body model, only stars at | x | ≤ 2.5 kpc and | y | ≤ 3 kpc from the galaxy center are shown. An initial radial metallicity profile [ Fe/H ] = 0.5−0.4R in the disk is assumed, similar to Martinez-Valpuesta & Gerhard (2013). Three different metallicity bins are shown, from top to bottom in decreasing [Fe/H], corresponding to the populations A, B, and C, as defined by Ness et al. (2013a). For each plot, four different latitudes are shown for the modeled galaxy: b = −4° (yellow squares), b = −6° (red squares), b = −8° (pale blue squares), b = −10° (dark blue squares). For comparison, ARGOS fields at b = −5° (orange, solid curve), b = −7.5° (pale blue, dashed curve), b = −10° (dark blue, dotted curve) for populations A, B, and C are also given. The thickness of the curves corresponds to the ± 1σ error in the observational data.
Current usage metrics show cumulative count of Article Views (full-text article views including HTML views, PDF and ePub downloads, according to the available data) and Abstracts Views on Vision4Press platform.
Data correspond to usage on the plateform after 2015. The current usage metrics is available 48-96 hours after online publication and is updated daily on week days.
Initial download of the metrics may take a while.