Fig. 3
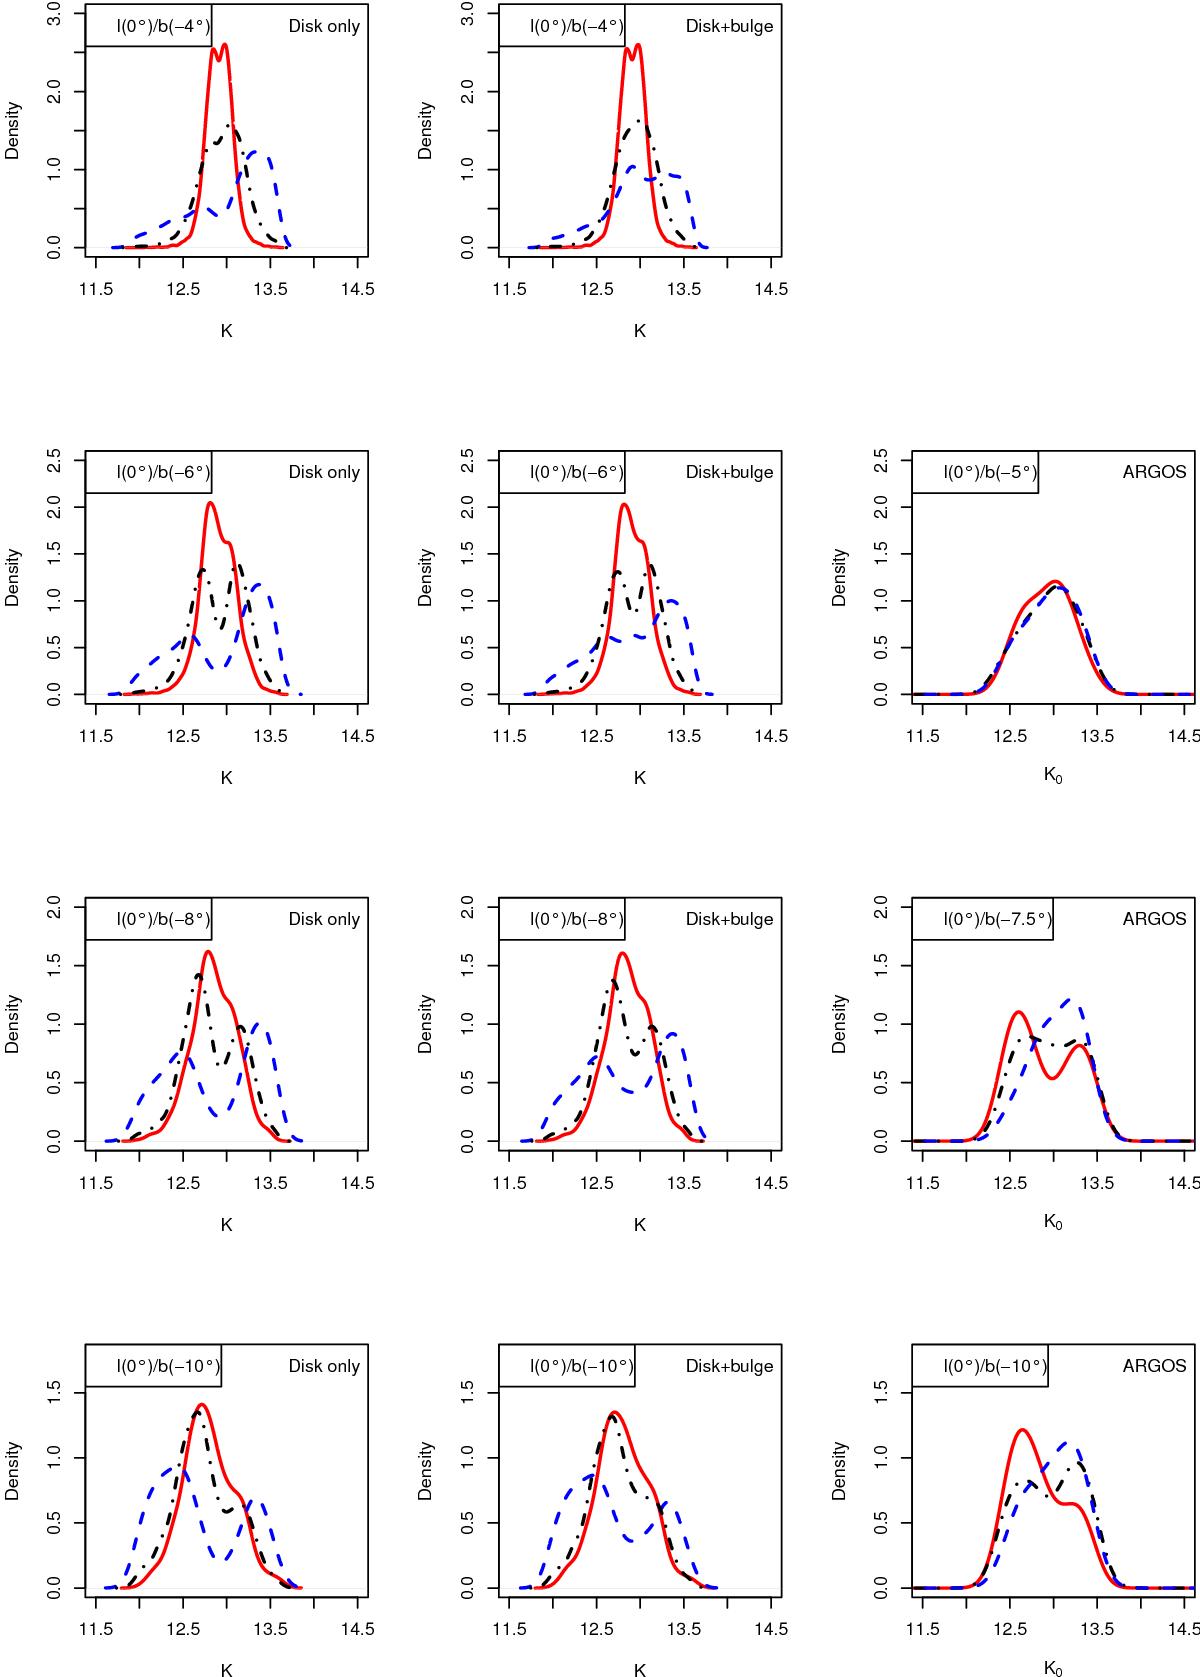
Left and middle columns: K-band magnitude distributions of red clump stars in the modeled galaxy at different latitudes along the bulge minor axis. An initial radial metallicity profile [ Fe/H ] = 0.5−0.4R in the disk is assumed, as in Martinez-Valpuesta & Gerhard (2013). Three different metallicity bins are then shown: [ Fe/H ] > 0 (red, solid curve), −0.5 < [ Fe/H ] ≤ 0 (black, dash-dotted curve), −1 < [ Fe/H ] ≤ −0.5 (blue, dashed curve), similar to populations A, B, and C, as defined by Ness et al. (2013a). Disk stars only are shown in the left panel, while all (i.e., disk and classical bulge) stars are shown in the right panel. In all panels, stars with (l,b) in the interval (l0,b0) ± (Δl,Δb) are shown, with Δl = Δb = 1° and (l0,b0) as given in the top left corner. Right column: K0-band magnitude distributions of red clump stars at different latitudes along the bulge minor axis from the ARGOS survey. See Ness et al. (2013a) for details.
Current usage metrics show cumulative count of Article Views (full-text article views including HTML views, PDF and ePub downloads, according to the available data) and Abstracts Views on Vision4Press platform.
Data correspond to usage on the plateform after 2015. The current usage metrics is available 48-96 hours after online publication and is updated daily on week days.
Initial download of the metrics may take a while.