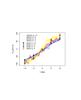
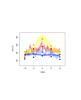
Fig. 1

Rotation curve (top panel) and velocity dispersions (bottom panel) of the stars of the N-body models at | x | ≤ 2.5 kpc and | y | ≤ 3 kpc from the galaxy center. Four different latitudes are shown for the modeled galaxy: b = −4° (yellow squares), b = −6° (red squares), b = −8° (pale blue squares), b = −10° (dark blue squares). For comparison, BRAVA fields at b = −4° (yellow, solid curve), b = −6° (red, dashed curve), and b = −8° (pale blue, dotted curve), and ARGOS fields at b = −10° (dark blue, dash-dotted curve) are also given. The thickness of the curves corresponds to the ± 1σ error in the observational data.
Current usage metrics show cumulative count of Article Views (full-text article views including HTML views, PDF and ePub downloads, according to the available data) and Abstracts Views on Vision4Press platform.
Data correspond to usage on the plateform after 2015. The current usage metrics is available 48-96 hours after online publication and is updated daily on week days.
Initial download of the metrics may take a while.