Free Access
Fig. 2
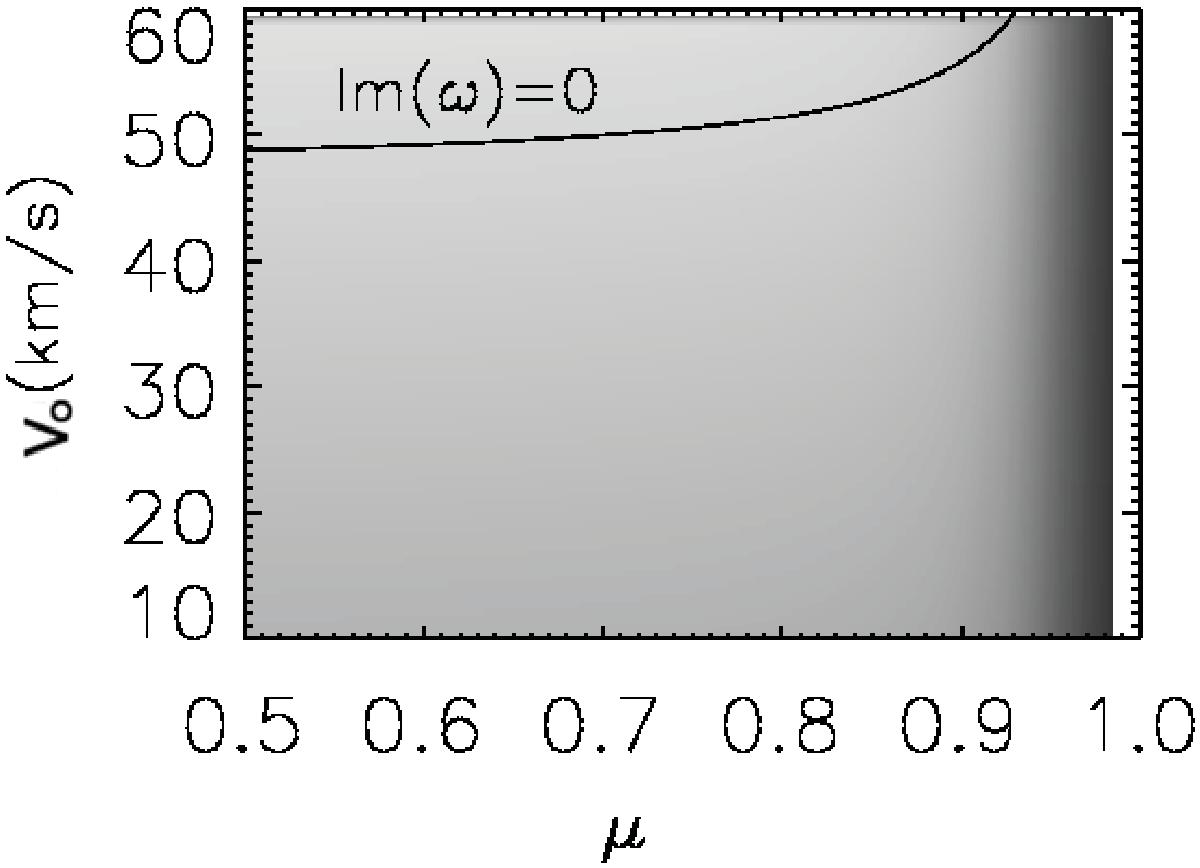
Contour plot of the variation of the imaginary part of the frequency for backward propagating waves. The region below the zero level curve corresponds to a stable regime and waves will have a classical damping, while the interface described by the quantities in the region above the curve is unstable.
Current usage metrics show cumulative count of Article Views (full-text article views including HTML views, PDF and ePub downloads, according to the available data) and Abstracts Views on Vision4Press platform.
Data correspond to usage on the plateform after 2015. The current usage metrics is available 48-96 hours after online publication and is updated daily on week days.
Initial download of the metrics may take a while.