Fig. 1
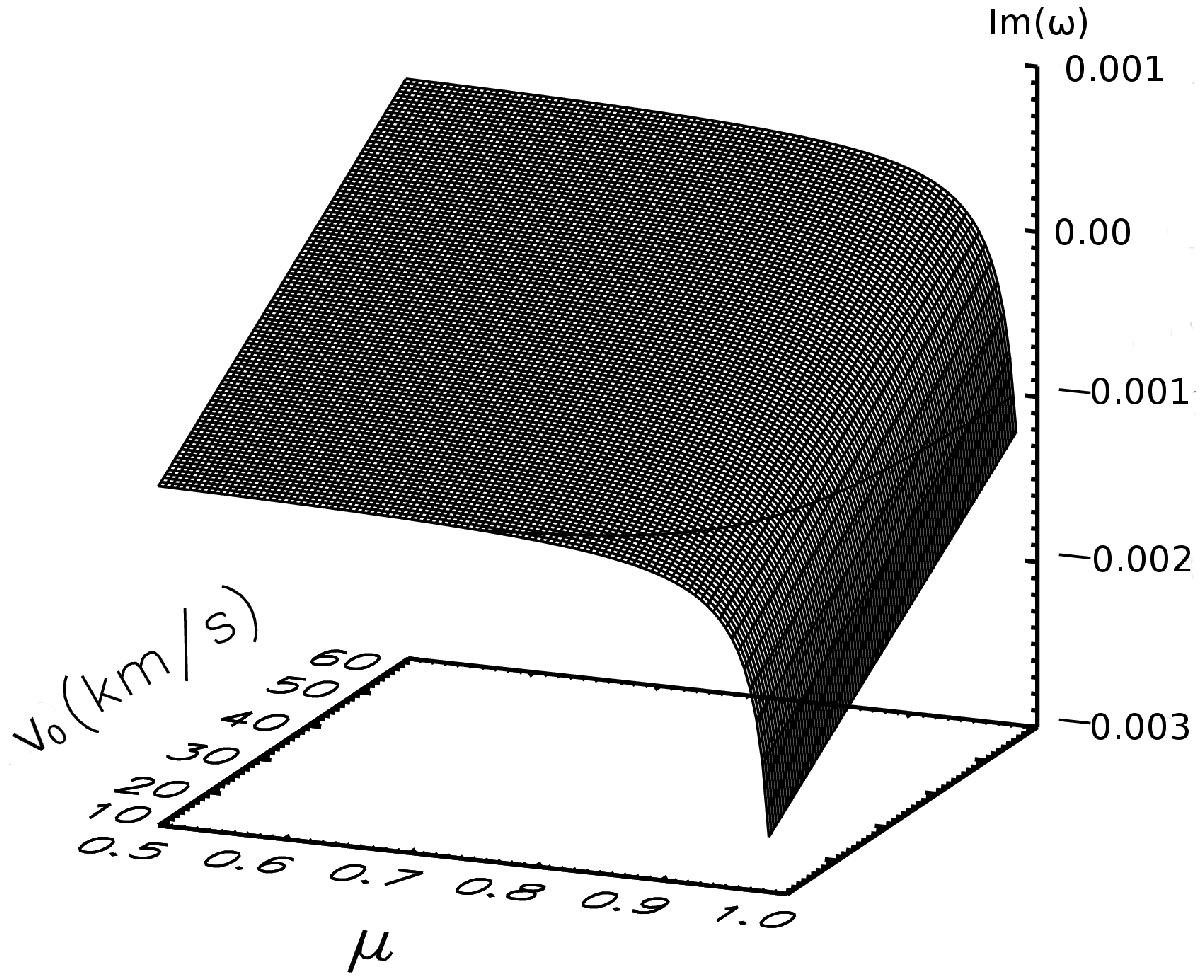
Variation of the imaginary part of the frequency for the backward propagating wave with the flow speed and the ionisation fraction. The flow changes in the interval 10–60 km s-1 and the ionisation fraction varies between 0.5 (fully ionised plasma) and 1 (neutral gas). The horizontal curve is drawn at the Im(ω) = 0 and helps to visualise the transition of Im(ω)− from the positive to the negative domain.
Current usage metrics show cumulative count of Article Views (full-text article views including HTML views, PDF and ePub downloads, according to the available data) and Abstracts Views on Vision4Press platform.
Data correspond to usage on the plateform after 2015. The current usage metrics is available 48-96 hours after online publication and is updated daily on week days.
Initial download of the metrics may take a while.