Fig. 8
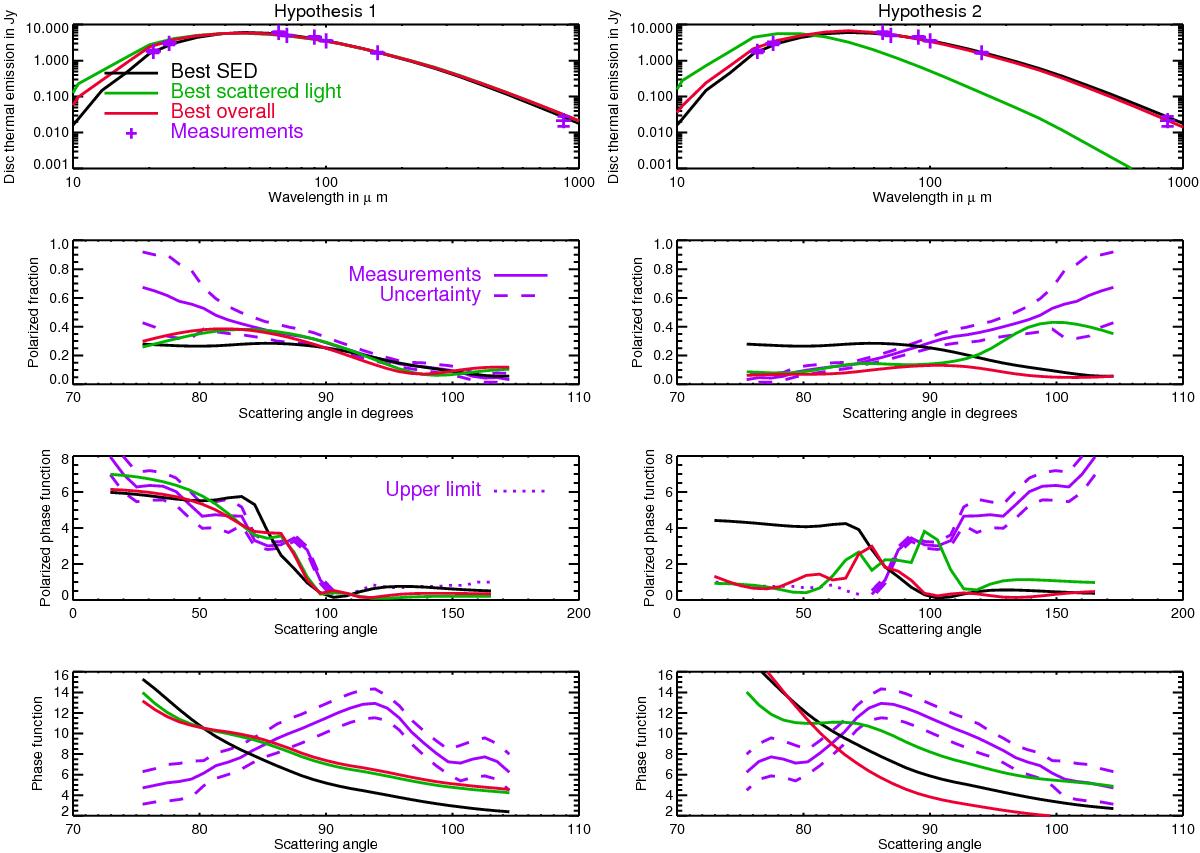
Comparison between the measurements (in purple) and the predictions of the best model for the SED (in black), the scattered light (in green), or overall (in red) with respect to four observables: the SED (first row), the polarised fraction (second row), the polarised phase function (third row), and the phase function (last row). The left column shows the best models in the scenarios H1 (NW side towards the Earth) and the right column shows the best models in the scenario H2.
Current usage metrics show cumulative count of Article Views (full-text article views including HTML views, PDF and ePub downloads, according to the available data) and Abstracts Views on Vision4Press platform.
Data correspond to usage on the plateform after 2015. The current usage metrics is available 48-96 hours after online publication and is updated daily on week days.
Initial download of the metrics may take a while.