Fig. 7
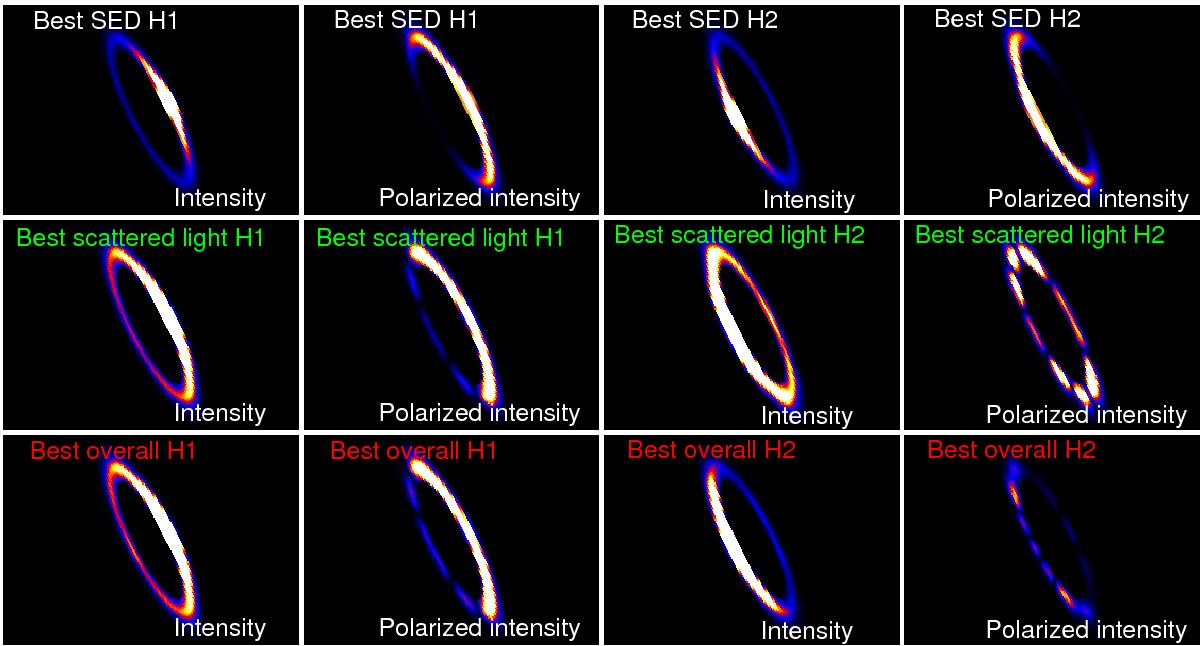
Unpolarised and polarised intensity of the best SED models (first row), the best scattered light models (second row), and the best overall models (last row), detailed in Table 5. The images on the left half refer to best models in the scenario H1 and the images on the right half refer to the best models in the scenario H2. The colour scale is linear for all images. The colour range is the same for all intensity images and is four times smaller for the polarised images.
Current usage metrics show cumulative count of Article Views (full-text article views including HTML views, PDF and ePub downloads, according to the available data) and Abstracts Views on Vision4Press platform.
Data correspond to usage on the plateform after 2015. The current usage metrics is available 48-96 hours after online publication and is updated daily on week days.
Initial download of the metrics may take a while.