Free Access
Fig. 12
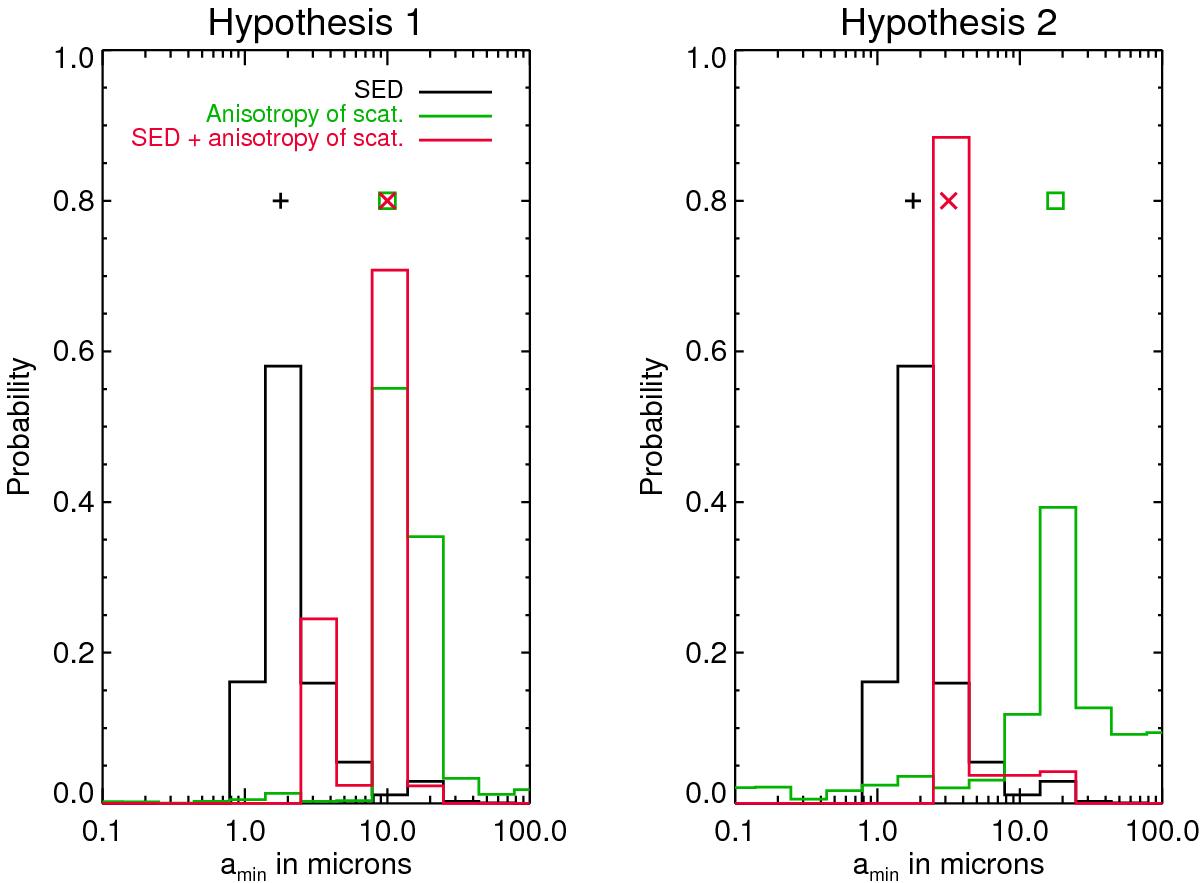
Marginal distributions of the parameter amin, based on fitting the SED (black histogram), the anisotropy of scattering at Ks and L′ (green histogram), or both (red histogram). The symbols (crosses and squares) indicate the value of the best models. These distributions are derived from models created using the DHS theory.
Current usage metrics show cumulative count of Article Views (full-text article views including HTML views, PDF and ePub downloads, according to the available data) and Abstracts Views on Vision4Press platform.
Data correspond to usage on the plateform after 2015. The current usage metrics is available 48-96 hours after online publication and is updated daily on week days.
Initial download of the metrics may take a while.