Fig. 7
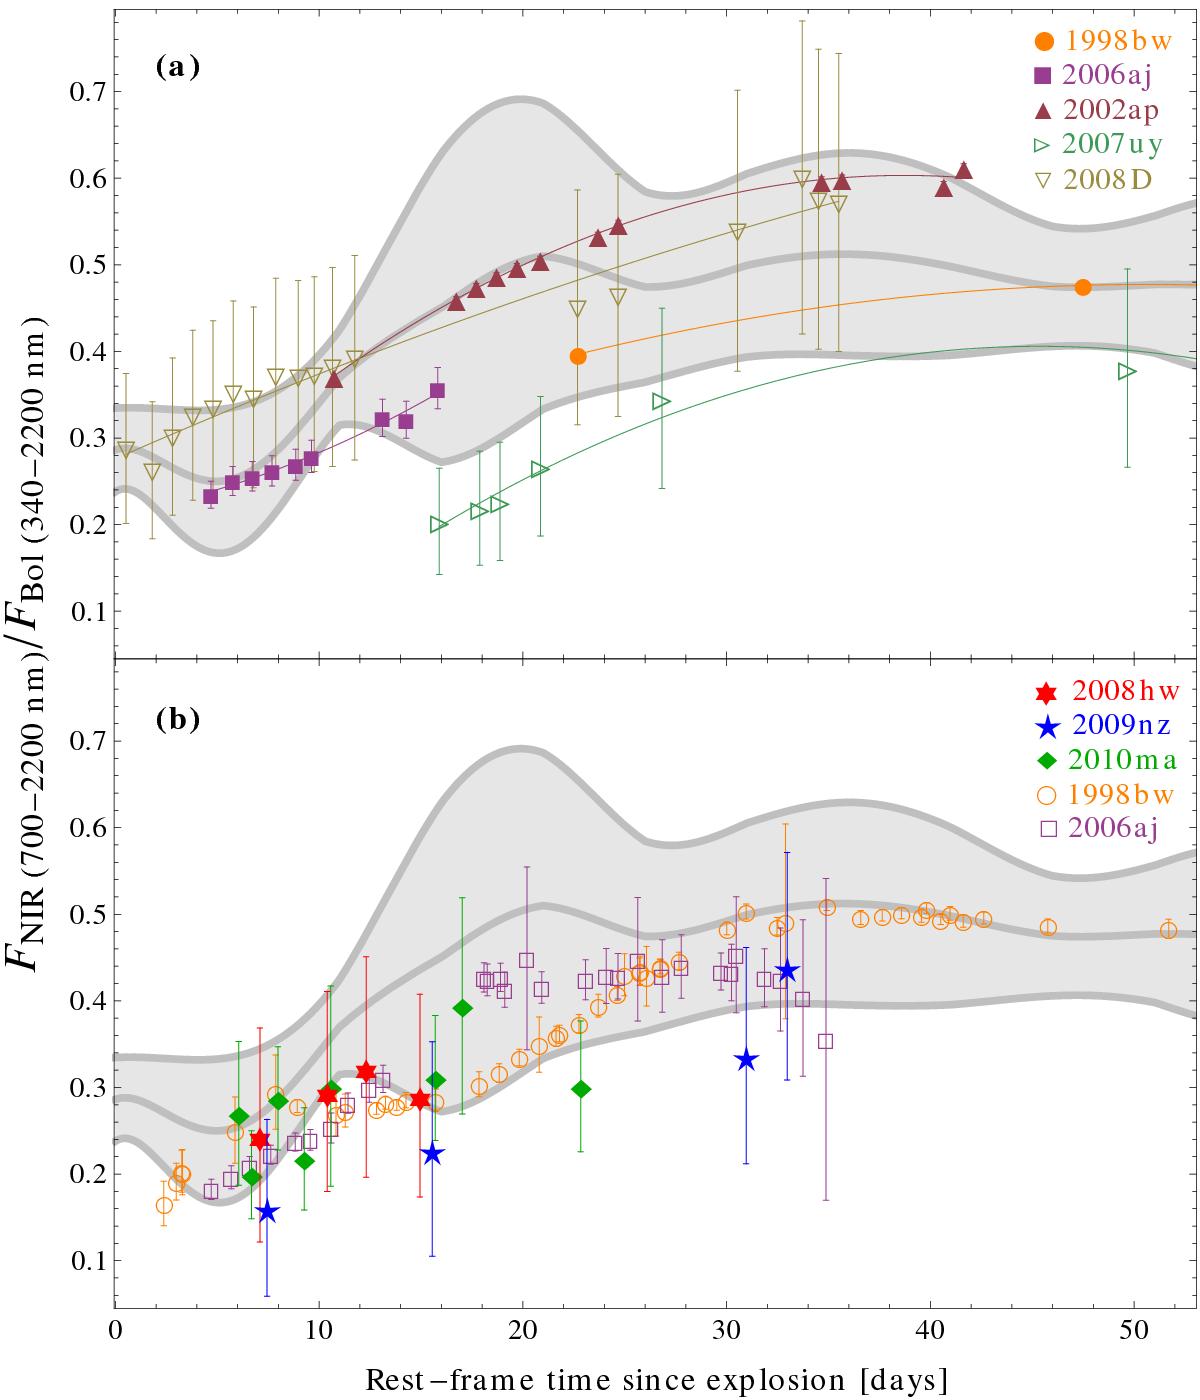
NIR fraction (700–2200 nm) of the quasi-bolometric flux (340–2200 nm) for SE SNe. a) The values derived using optical/NIR data of five SE SNe are fitted separately (coloured solid lines), averaged, and interpolated (grey solid line and 1σ contours). b) The estimations from the BB fits to optical data are shown for five GRB-SNe along with the contours from the top panel. See main text for the references of the data sources.
Current usage metrics show cumulative count of Article Views (full-text article views including HTML views, PDF and ePub downloads, according to the available data) and Abstracts Views on Vision4Press platform.
Data correspond to usage on the plateform after 2015. The current usage metrics is available 48-96 hours after online publication and is updated daily on week days.
Initial download of the metrics may take a while.