Fig. 1
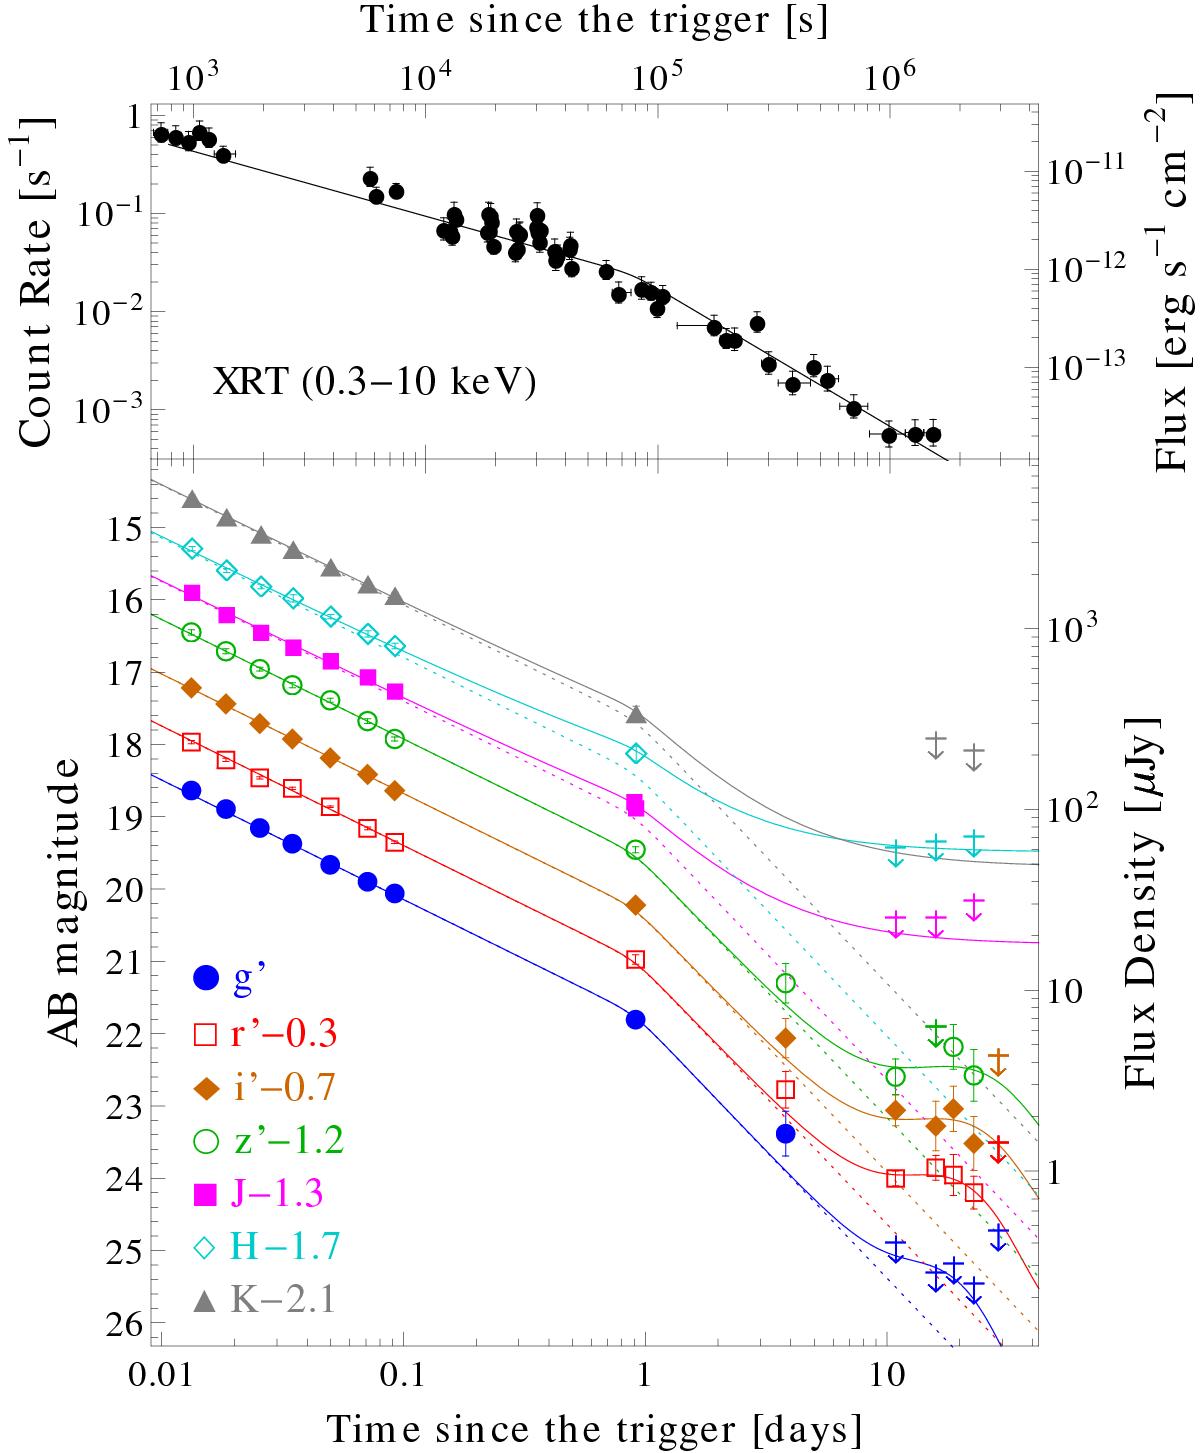
Multicolour light curves of GRB 081007/SN 2008hw corrected for Galactic extinction as observed by the Swift/XRT (upper panel) and GROND (lower panel). Filled circles represent detections and arrows are upper limits. Solid lines correspond to the overall fits and dotted lines to the AG component. For clarity, light curves were shifted along the magnitude axis. Shallow upper limits are not shown (see Table A.1 for the complete data set).
Current usage metrics show cumulative count of Article Views (full-text article views including HTML views, PDF and ePub downloads, according to the available data) and Abstracts Views on Vision4Press platform.
Data correspond to usage on the plateform after 2015. The current usage metrics is available 48-96 hours after online publication and is updated daily on week days.
Initial download of the metrics may take a while.