Fig. 8
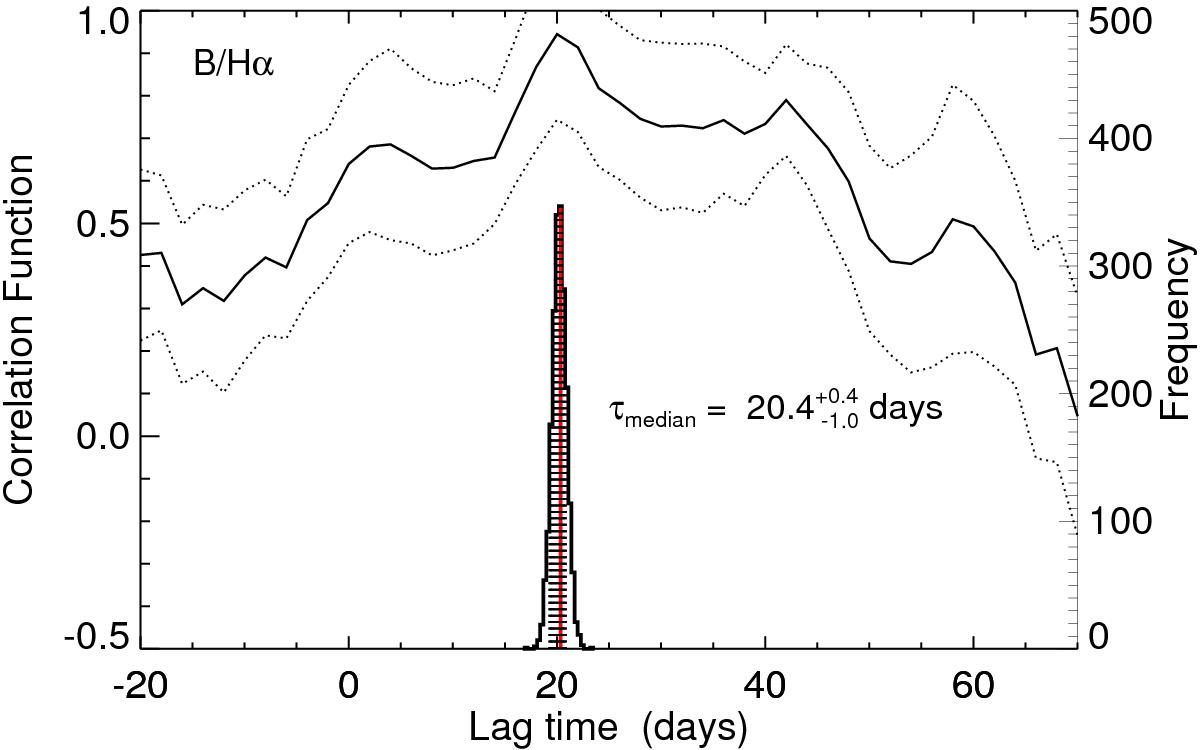
Cross correlation of B and Hα light curves for campaign 2011. The dotted lines indicate the error range (± 1σ) around the cross correlation. The centroid was calculated above the correlation level at r ≥ 0.8rmax. The histogram shows the distribution of the centroid lag obtained by cross correlating 2000 flux randomized and randomly selected subset light curves (FR/RSS method). The black shaded area marks the 68% confidence range used to calculate the errors of the centroid.
Current usage metrics show cumulative count of Article Views (full-text article views including HTML views, PDF and ePub downloads, according to the available data) and Abstracts Views on Vision4Press platform.
Data correspond to usage on the plateform after 2015. The current usage metrics is available 48-96 hours after online publication and is updated daily on week days.
Initial download of the metrics may take a while.