Fig. 3
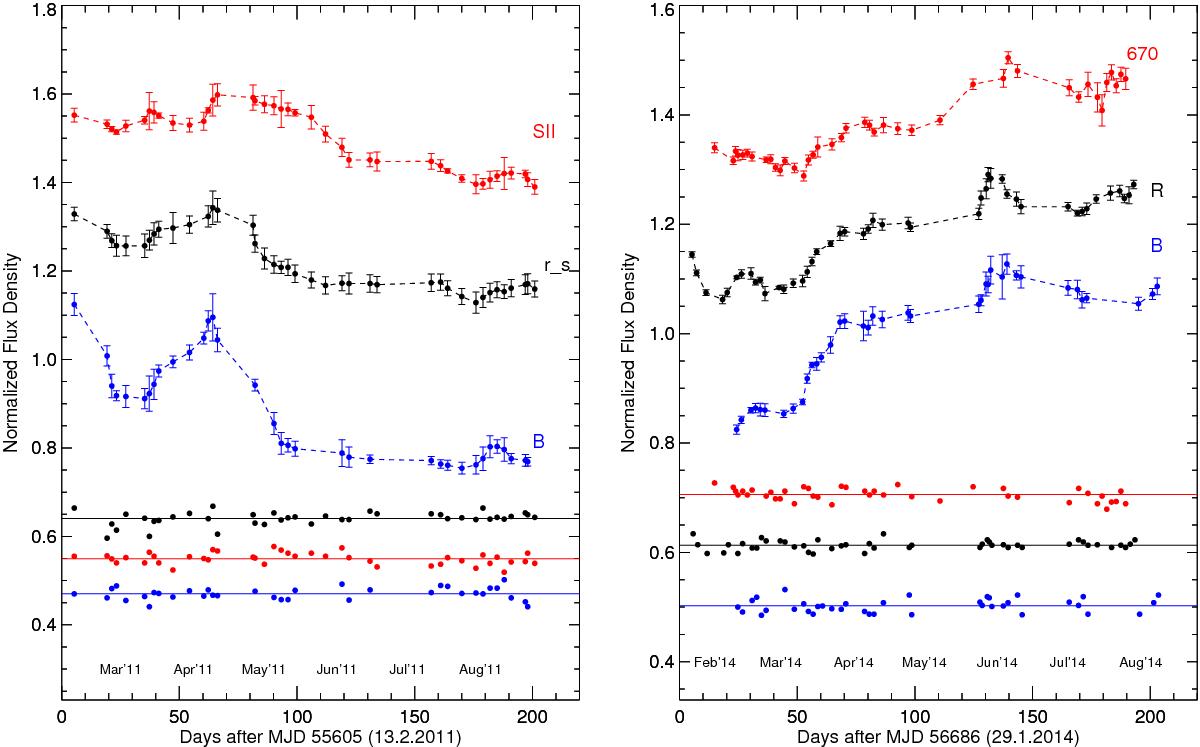
Observed light curves of PGC 50427, as well as for some of the reference stars in the field of view for the period between February 2011 and September 2011 (left) and for the period between February 2014 and August 2014 (right). The light curves are vertically shifted for clarity.
Current usage metrics show cumulative count of Article Views (full-text article views including HTML views, PDF and ePub downloads, according to the available data) and Abstracts Views on Vision4Press platform.
Data correspond to usage on the plateform after 2015. The current usage metrics is available 48-96 hours after online publication and is updated daily on week days.
Initial download of the metrics may take a while.